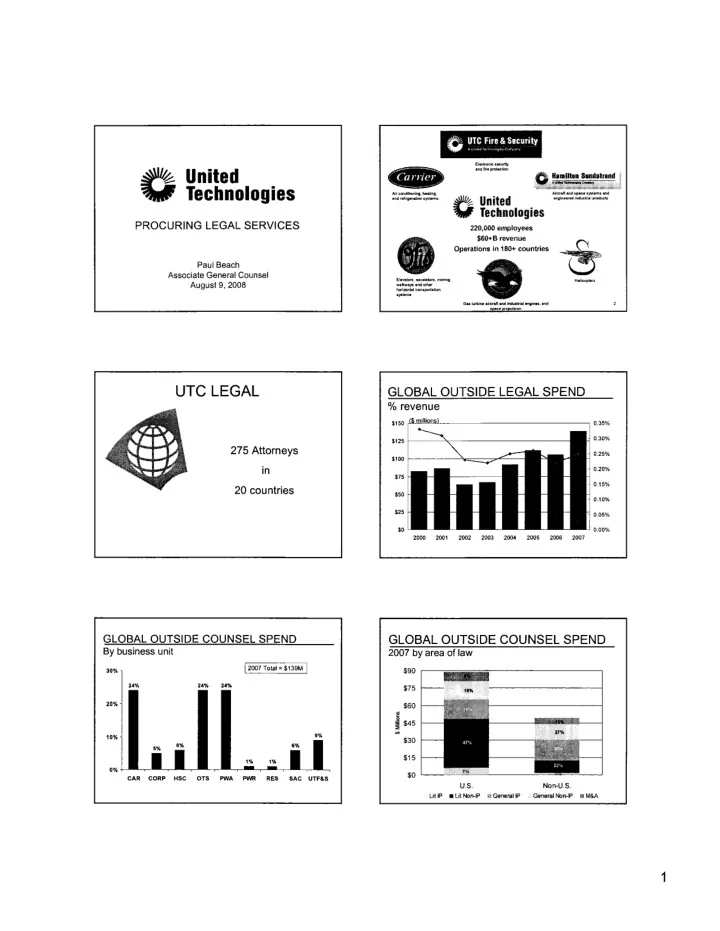

~ o ~v~:~~,i:~,:~urity Elltlrnicslturity indfifiproan ~~ United V Technologies Air conditning. hea~nii, Aircrit\iindspacesyslimsiind Indr.rrillrliliOfsyslems A United iiniiiniiiirllindu!ilriiiprucl V Technologies Operations in 180+ countries ~ PROCURING LEGAL SERVICES 220,000 employees e $60+B revenue Paul Beach Associate General Counsel ElivalDl1,uciiatars,motl Hiilicoptrs August 9, 2008 wiilkwiysindolhiir horimnl"llriinsporltion systema Gas turbine i¡r:r.~~~ii:::: IlIines. imd UTe LEGAL GLOBAL OUTSIDE LEGAL SPEND % revenue 0.35% $150 0.30% $125 275 Attorneys 0.25% $100 0.20% in $75 0.15% 20 countries $25 0.05% $50 0.10% $0 0.00% 2000 2001 2002 2003 2004 2005 2006 2007 GLOBAL OUTSIDE COUNSEL SPEND GLOBAL OUTSIDE COUNSEL SPEND By business unit 2007 by area of law 30% 12007 Total = $139M I $90 24% 24% 24% $75 20% $60 ~ ~ $45 ~ 9% 10% $30 5% 6% $15 1% 1% 0% $0 CAR CORP HSC OTS PWA PW RES SAC UTF&S U.S. Non-U.S. Lit IP . Lit Non-IP M GenerailP General Non-IP a M&A 1
LEGAL SERVICES INITIATIVE (circa 1999) PREFERRED COUNSEL PROGRAM Cost Reduction Tools Consolidation 900 us Convergence . Non-U,S. 730 750 ~Total Volume Discounts m 600 Engagement Guidelines 410 450 Preferred Support 300 Vendors 150 Compliance via E- Invoicing 2000 2001 2002 2003 2004 2005 2006 2007 PREFERRED COUNSEL PROGRAM CENTRA TION CON Firms accounting for 75% of global spend 233 firms approved for new work 100 500 421 410 78 400 80 62 300 60 53 42 200 37 34 40 32 100 20 2005 2006 2007 0 . Preferred . Recommended m No new matters Unapproved 1999 2000 2001 2002 2003 2004 2005 PREFERRED COUNSEL PREFERRED COUNSEL SPEND % of Total Counsel Spend -109 Worldwide 100% Europe 8B% 90% 18 BO 70''- 60'- 50% 41% 40% 30''- 20''- 10''- 0''- 2000 2002 2003 2004 2005 2006 2007 2001 2
LEGAL SERVICES INITIATIVE ENTERPRISE LEGAL Limit of the Initial Approach 2003 v. 2007 310 2003 2007 % 290 Revenues 77% $31 B $54.8 B 270 Employees 203,300 225,600 11% L Margin ¡Gapf ii 250 Attorneys 182 242 :: 33% ~ 230 Attorneys J SB revenue 5.9 4.4 (25%) ;; 210 Total outside legal spend $65 M $139 M 113% 190 IP (Lit & Non-Lit) 377% $9 M $43 M 170 Non IP Spend 71% $56 M $96 M 150 Outside legal spend as % .22% .25% 19% Year 2 Year 3 Year 4 Year 5 of Revenues Year 1 LEGAL SERVICES INITIATIVE LEGAL SERVICES INITIATIVE Current Approach Cost Reduction Tools Now... Initially.. . Price Convergence . Intensify Management of Top Spend Mailers Volume Discounts . Leverage Spend Consolidation Through Cost Engagement Guidelines Alternative Fee Arrangements Preferred Support . Establish Best Practices Vendors . Productivity Metrics Year 1 Year 2 Year 3 Year 4 Year 5 Compliance via E- Invoicing ALTERNATIVE FEES ALTERNATIVE FEES Goals Types Contingency fees Incentivize Effciency Partial contingency - "Success Fee" Predictability Flat fees Strengthen Partnering Fixed fees with bands Focus on Process Knowledge Management Retainer for 7/24 access to simple advice - Continuous Process Improvement ACES ™ (considering) Discounted/Blended Hourly Rates are not Alternative Fees 3
ALTERNATIVE FEES ALTERNATIVE FEES Allocation Global Spend 2006 2007 2006 2008 PRIORITIES Attack the U.S. spend seek to move aiay from high-cost firms better cost management of high-cost matters more aggressive early ADR Affirmative litigation on partial/full contingency Restructure Preferred Counsel agreements mandate alternative fees hourly rate freeze mandate ACE/Six Sigma process improvements Does economic downturn offer opportunities for retainers? 4
Recommend
More recommend