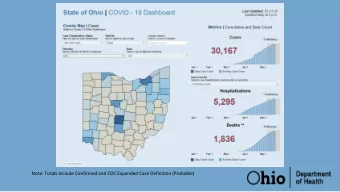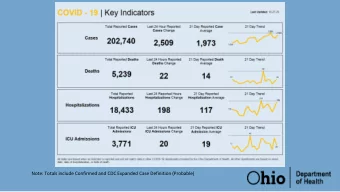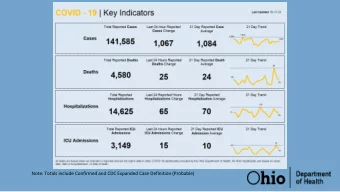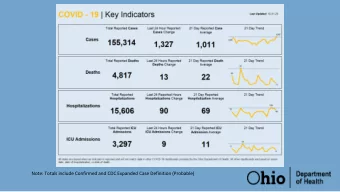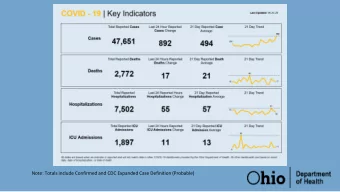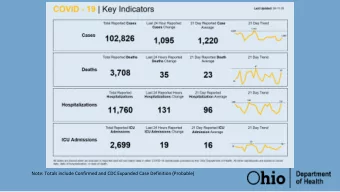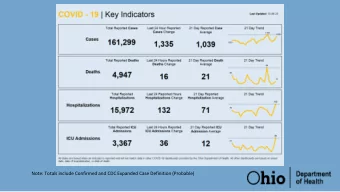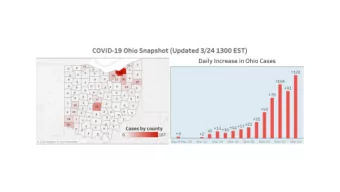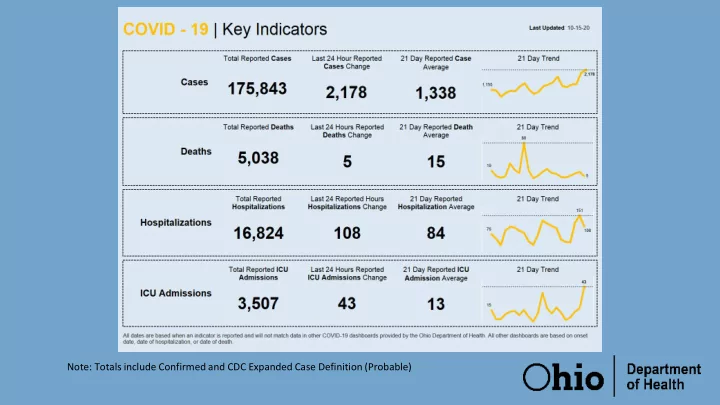
Note: Totals include Confirmed and CDC Expanded Case Definition (Probable)
Alert System Level by Percentage of Ohio’s Population and Week 100% 5 Cty 6 Cty 6 Cty 7 Cty 9 Cty 11 Cty 10% 9 Cty 12% 13% 90% 13% 18 Cty 15% 20% 24% 11 Cty 12 Cty 26% 7 Cty 13 Cty 80% 37% 37% 12 Cty 39% 23 Cty 44% 19 Cty 50% 29 Cty 70% 53% 59% 65% 60% 42 Cty 42 Cty 48 Cty 47 Cty 52 Cty 61% 63% 70% 50% 51 Cty 67% 50 Cty 74% 27 Cty 67% 58 Cty 63% 40% 48 Cty 51 Cty 39% 52 Cty 35 Cty 70% 38 Cty 51% 53% 44% 30% 33% 36 Cty 33% 28% 52 Cty 20% 39 Cty 40 Cty 34% 54 Cty 35 Cty 32 Cty 41 Cty 10% 27 Cty 30 Cty 29 Cty 26% 26 Cty 33 Cty 23 Cty 28 Cty 24% 26 Cty 22% 20% 18% 17% 12 Cty 14% 14% 7 Cty 13% 13% 13% 12% 12% 10% 0% 4% 2% July 2 July 9 July 16 July 23 July 30 Aug 6 Aug 13 Aug 20 Aug 27 Sep 3 Sep 10 Sep 17 Sep 23 Sep 30 Oct 7 Oct 14 Source: Ohio Public Health Advisory System
Recommend
More recommend
Unleash a World of Digital Possibilities—Browse, Share, and Explore Content Without Boundaries