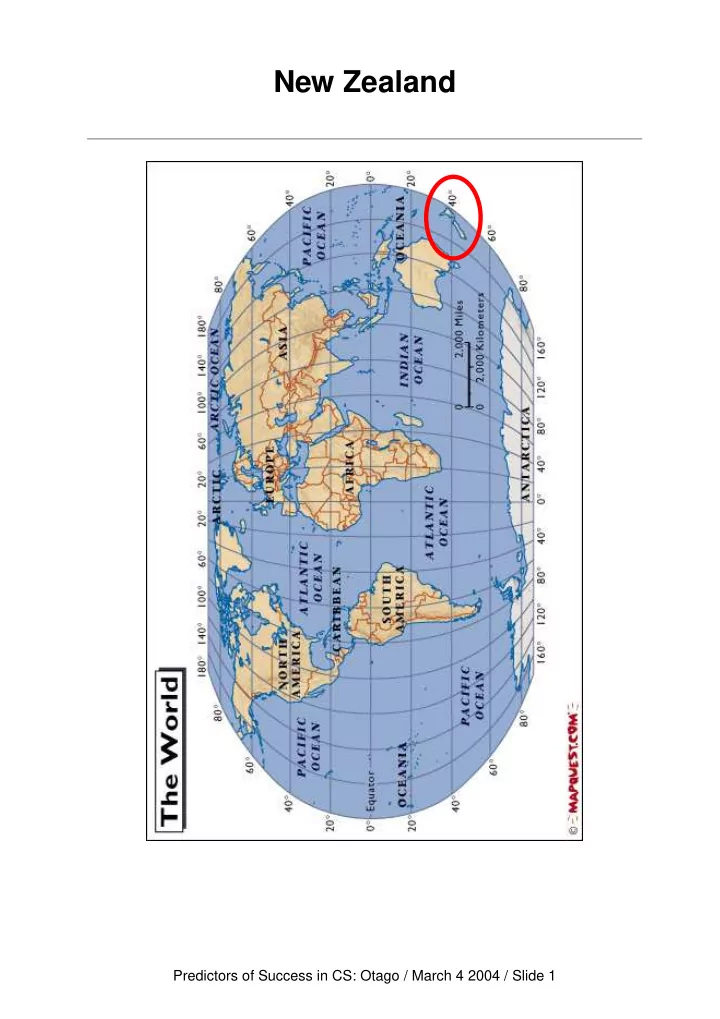

New Zealand Predictors of Success in CS: Otago / March 4 2004 / Slide 1
University of Otago Predictors of Success in CS: Otago / March 4 2004 / Slide 2
Our Introductory Programming Course From 1999: Java, Koffman and Wolz About 350 students each year Compulsory for major in Computer Science or Information Science May be taken as an elective by any student No prior or concurrent math requirement (or any other requirement for that matter) Predictors of Success in CS: Otago / March 4 2004 / Slide 3
Our CS Education Research Change to Java, change in teaching orientation Course Coordinator originally a psychologist I’m originally a piano teacher Failure rate is high; students who fail often surprised Observation: “studying hard” has little effect Started asking “what’s the difference between an effective novice and an ineffective novice?” Reviewed literature: found the standard stuff on experts vs novices. (Published in Computer Science Education as Learning and Teaching Programming: A review and discussion , Robins, Rountree and Rountree, 2002 if you’re interested.) Predictors of Success in CS: Otago / March 4 2004 / Slide 4
Our Empirical Research We felt we needed to be able to say what our students were like. Ran a survey over 2 semesters to try to gauge strength associations between background/expectations and success in our course. Most obvious result: Pass Fail Total Answered 345 (73%) 127 472 Did not answer 152 (55%) 124 276 497 (66%) 251 748 Predictors of Success in CS: Otago / March 4 2004 / Slide 5
Questions Gender Age Full-time status Year at university Major subject How keen are you to take this paper? Recent math (school, uni, other, none) Background (Humanities, Science, Commerce) Do you know a programming language already? How difficult do you expect this paper to be? How much work do you expect this paper to be? What grade do you expect to get? Are you going to continue in Computer Science? Predictors of Success in CS: Otago / March 4 2004 / Slide 6
Results All questions except gender and full-time status showed some better-than-chance association. Notably Strong: 80% of students aged 16–18 passed, 72% of 19–21, 54% of 22-24, 74% of 25+ 90% of students who expected to get an A passed. 85% of students who said they were extremely keen to sit the paper passed. 68% with school as most recent math passed, 78% with university math passed, 81% who reported “other” passed, 58% of those who reported “none” passed. Predictors of Success in CS: Otago / March 4 2004 / Slide 7
Danger Zones and Success Zones First year: Not looking for an A and Not majoring in cosc or info and Neither “extremely keen” nor “neutral” Group size: 38, Pass 53% Second year: Not looking for an A and No recent university or “other math” Group size: 29, Pass 38% Third year: Background not reported as science Group size: 20, Pass 40% Fourth year: Don’t know a programming language and Think difficulty will be same or easier Group size: 12, Pass 33% Predictors of Success in CS: Otago / March 4 2004 / Slide 8
Success Zone All years: Expect an A and Background is science Group size: 84, Pass 88% All years: Expect an A and Background is science and Age is 16–18 Group size: 31, Pass 100% (90% B or better) Predictors of Success in CS: Otago / March 4 2004 / Slide 9
What Next? How to get the message across to students? Aptitude test development Early mastery tests Epistemological beliefs Analogies Predictors of Success in CS: Otago / March 4 2004 / Slide 10
Recommend
More recommend