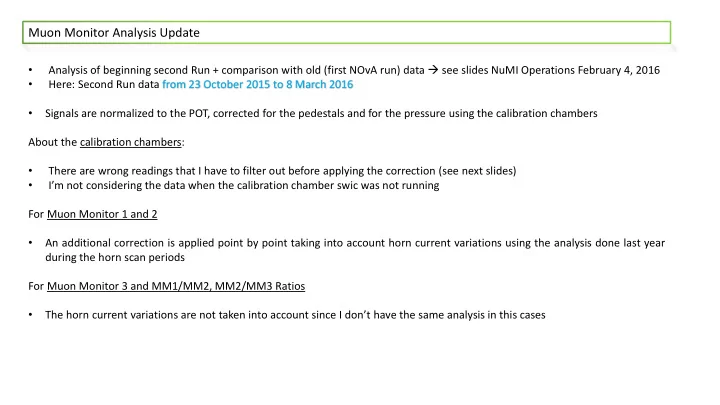

Muon Monitor Analysis Update • Analysis of beginning second Run + comparison with old (first NOvA run) data see slides NuMI Operations February 4, 2016 • Here: Second Run data from 23 October 2015 to 8 March 2016 • Signals are normalized to the POT, corrected for the pedestals and for the pressure using the calibration chambers About the calibration chambers: • There are wrong readings that I have to filter out before applying the correction (see next slides) • I’m not considering the data when the calibration chamber swic was not running For Muon Monitor 1 and 2 • An additional correction is applied point by point taking into account horn current variations using the analysis done last year during the horn scan periods For Muon Monitor 3 and MM1/MM2, MM2/MM3 Ratios • The horn current variations are not taken into account since I don’t have the same analysis in this cases
Muon Monitors – Calibration Chambers Here’s an example for Calibration Chamber104 (MM1) same considerations are valid for the other 2 Calib. Ch. • There are wrong data clearly out of the distribution • There are periods when the calibration chamber swic was not running don’t compute the corresponding MM signal in those cases • Plus, we need to filter out wrong readings, can’t really just cut them since they’re in the Wrong readings distribution of the good values to be filtered
Muon Monitor 1 and Muon Monitor 2 – Correction for the Horn Current variations Second Run – before horn current correction – POT norm, Ped&Press Corr. Last year I analyzed the MM data during the horn current scans so we can check what happens applying a MM1 correction for the current variation Measured values during the Horn Scans in 2015 13Oct2015 8Mar2016 Use fit parameters to apply correction MM2 for horn current variations point by point 13Oct2015 8Mar2016 Horn Current The correction applied is m’ = m measured – m expected + m nominal from fit MM1 nominal value from Run1: 0.2699 13Oct2015 8Mar2016 MM2 nominal value from Run1: 1.244
Muon Monitor 1 – Correction for the Horn Current variations Before Horn Current Correction After correction -2% variation since beginning of Run2 -1.7% in the first period (<17Jan) -0.3% in the second period (>17Jan) 23Oct2015 17Jan2016 8Mar2016
Muon Monitor 2 – Correction for the Horn Current variations Before Horn Current Correction After correction MM2: -1% variation since beginning of Run2 -1.% in the first period (<17Jan) -0.2% in the second period (>17Jan) 23Oct2015 17 Jan2016 8Mar2016
Muon Monitor 1&2 after Horn Current Correction Vs POT 13Oct2015 8Mar2016
Muon Monitor 3 and MM1/MM2, MM2/MM3 Ratios MM3: +5% from Run start to 17 Jan +2% after 17 Jan 23Oct2015 17Jan 2016 8Mar2016 MM1/MM2: -0.2% variation since beginning of Run2 ….The ratio is very stable as expected since MM1&MM2 have the same behaviour 23Oct2015 8Mar2016 MM2/MM3: -7% from Run start to 17 Jan -2% after 17 Jan ..as expected because MM2 decreases while MM3 increases 23Oct2015 17Jan 2016 8Mar2016
Muon Monitor 3 and MM1/MM2, MM2/MM3 Ratios VS POT
Muon Monitors – Centroids My definition: • I defined the horizontal and vertical positions taking the distances from one chamber center to the next chamber center • The horizontal distance between two chambers is 25,4 cm, same for vertical • The central chamber corresponds to (0,0) position, negative positions are on the left and on the bottom, positive positions on the right and on the top
Muon Monitors – Centroids MM1 &MM2 Horizontal Centroid <0.5cm variation since Run start Gas change + beam restart (not stable) MM1 &MM2 Vertical Centroids are known to follow the horn current
Muon Monitor 1 – Centroids, Horn Current and POT MM1 Vertical MM1 Centroid has Horizontal about 1 cm Centroid is decrease since very stable. beginning of There’s a little the run but jump in March last period at the beam looks stable (it restart but we follows the should see horn current) with next data a stable behavior again
Muon Monitor 2 – Centroids, Horn Current and POT MM2 Vertical MM2 Centroid has Horizontal about 1 cm Centroid has a decrease since variation at beginning of the order of a the run but mm. last period Same little looks stable (it jump when follows the the beam horn current) restarted
Muon Monitor Analysis Update - Conclusions • Second Run data analysed: from 23 October 2015 to 8 March 2016 • Signals are normalized to the POT, corrected for the pedestals and for the pressure using the calibration chambers. • For the first and second muon monitor a correction to take into account the horn current variation is also applied Since the beginning of the run the signal decrease is about 1,2 % but after the 17 th of January the signals become much more stable (<<1% variation) • The third muon monitor increases since the Run start, it looks like it’s more stable after January 17 (..still it shows a +2% increase) • The MM1/MM2 ratio is as expected very stable and the MM2/MM3 ratio decreases since the MM3 signal increases • The signals w.r.t. the POT look ok • The vertical centroids follow the horn current as already seen in the past. It looks like they are more stable in the last part of the run (the variations are anyway of the order of the cm) • The horizontal centroids are very stable, at the mm level Keep monitoring
Recommend
More recommend