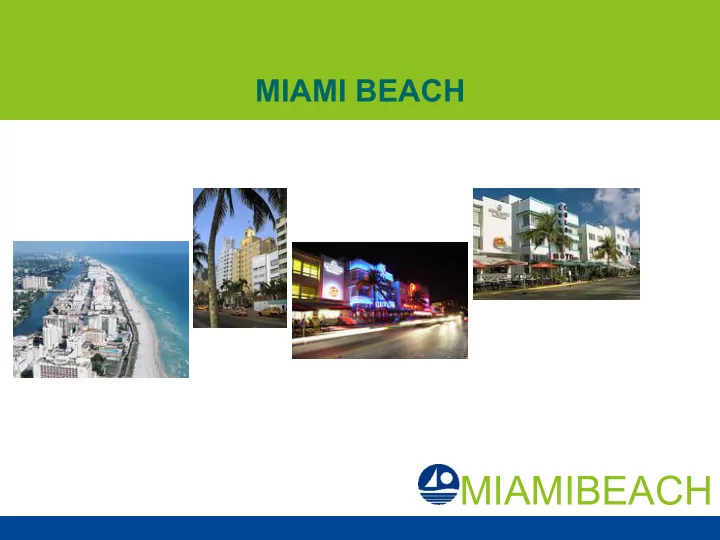

MIAMI BEACH MIAMIBEACH
BASIC DEMOGRAPHICS Land area is 7 square miles Permanent population ~ 88,000 Average daily population ~ 182,000 Annual beach patrons 16 million Highly urban Housing units per sq. mile 9,300 Taxable property value $23 billion
TOPOGRAPHIC DATA Low and relatively flat terrain • Coastal dune • Mangrove swamp • Manmade islands High imperviousness • Existing Development • New Construction Tidal constraints High groundwater table Aging infrastructure in corrosive conditions
STORMWATER MANAGEMENT MASTER PLAN
STORMWATER BASICS Storm water flows to catch basins Through large pipes Outfalls into Biscayne Bay When the sea level rises: Water flows more slowly or even flows from the Bay to the streets
STORMWATER MANAGEMENT MASTER PLAN The previous City Stormwater Management Master Plan was developed in 1997. Old Plan determined needs by: • water quality • flooding potential • citizen complaints • City staff ranking New Plan determined needs by: • City-wide model analysis • water quality • incorporates sea-level rise projections
RAINFALL INUNDATION MAPPING 6 inch rainfall event flooding with tidal elevation of 0.5 ft NAVD up from -0.9 ft NAVD normal tide condition MIAMIBEACH
TWO SEA LEVEL RELATED QUESTIONS What is the present sea level? How fast is it rising? MIAMIBEACH
STORMWATER MANAGEMENT MASTER PLAN 0.9 USACE NRC Curve I (Low) 0.84 0.8 USACE NRC Curve II (Intermediate) USACE NRC Curve III (High) 0.7 0.67 Virginia Key Tidal Data Mean High Water (ft NAVD) 0.6 0.51 0.5 0.4 0.36 0.3 0.29 0.2 0.16 0.1 NOAA ¡Epoch ¡ Annualized ¡Virginia ¡Key ¡ ¡ NOAA ¡ ¡Data ¡(1996-‑2011) ¡ 0 1980 1985 1990 1995 2000 2005 2010 2015 2020 2025 2030 Year USACE curves are based on the Engineering Circular EC 1165-2-212, published on October 1, 2011 and expires September 30, 2013.
STORMWATER MANAGEMENT MASTER PLAN
GOING FORWARD Add flexibility to stormwater system • backflow preventers at outfalls • stormwater pump stations • future storage • raise seawalls Monitor change in sea level and refine future adaptation strategies Re-prioritize infrastructure requirements, as needed Gain community acceptance Develop long-term financing
MIAMI BEACH IN 20 YEARS AND BEYOND After over $200 million in stormwater infrastructure investment • Improved drainage system • Adaptable system • City more resilient Future policy considerations • Seawalls • Surge protection • City climate action plan
MIAMI BEACH MIAMIBEACH
Recommend
More recommend