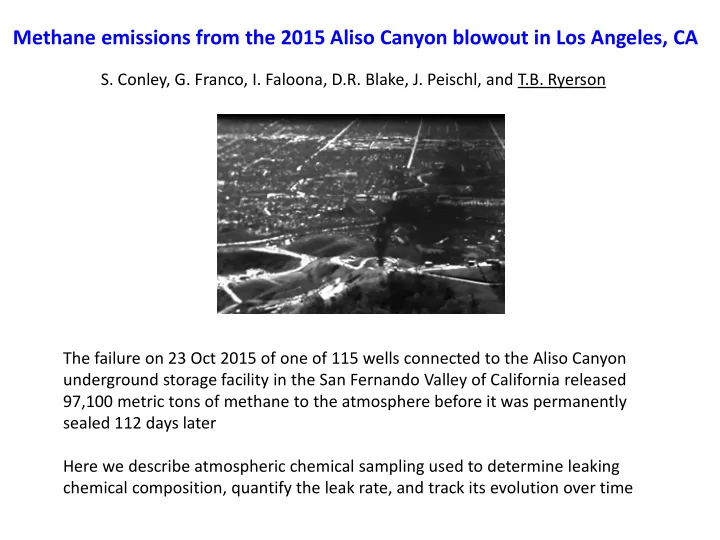

Methane emissions from the 2015 Aliso Canyon blowout in Los Angeles, CA S. Conley, G. Franco, I. Faloona, D.R. Blake, J. Peischl, and T.B. Ryerson The failure on 23 Oct 2015 of one of 115 wells connected to the Aliso Canyon underground storage facility in the San Fernando Valley of California released 97,100 metric tons of methane to the atmosphere before it was permanently sealed 112 days later Here we describe atmospheric chemical sampling used to determine leaking chemical composition, quantify the leak rate, and track its evolution over time
Methane emissions from the 2015 Aliso Canyon blowout in Los Angeles, CA Chemical composition from whole-air sampling enhancement ratios relative to methane Molar enhancement ratios from UCI WAS canisters taken ~6 weeks apart: - define chemical composition of leaking Aliso Canyon gas and oil - are consistent with reports of “oily sheens” in affected areas downwind - suggest leaking chemical composition was constant over time - provide a means to estimate benzene levels from methane observations
Methane emissions from the 2015 Aliso Canyon blowout in Los Angeles, CA Scientific Aviation Mooney TLS aircraft Mass fluxes were calculated from 13 flights for all horizontal crosswind transects downwind of the leak site Two separate instruments measured methane, and one measured ethane, every 30 m along track
Methane emissions from the 2015 Aliso Canyon blowout in Los Angeles, CA 10 Nov 2015 flight example Methane and ethane measured continuously aboard the aircraft Benzene and odorant calculated from known, or assumed, ERs relative to methane • Plume consistent with a single point source centered on the SS-25 wellpad within ±100m • Rules out any substantial contribution from other local wells or upwind sites • Exceptionally restricted airspace access (terrain, traffic, TFRs…) dictated an agile aircraft with FAA clearance for 60m above ground • Repeated transects at 34.295 ° latitude show the aircraft captured the full horizontal extent of the point source plume on each flight
Methane emissions from the 2015 Aliso Canyon blowout in Los Angeles, CA 10 Nov 2015 flight example Methane and ethane measured continuously aboard the aircraft Benzene and odorant calculated from known, or assumed, ERs relative to methane • Repeated transects at 34.295 ° latitude show the aircraft captured the full vertical extent of the point source plume on each flight wind • simultaneous NOAA mobile van CH 4 , CO 2 , N 2 O, CO, and wind vector measurements at the surface directly below the aircraft on 11 January 2016 show negligible concentration gradients below lowest aircraft flight altitude • integrating horizontal fluxes in the vertical North-south topographical cross section provides a direct, accurate measurement of Aliso at the SS-25 well longitude Canyon gas leak rate, with known uncertainties Aircraft altitude (grey line) scaled by chemical data for CH 4 > 3 ppm
Methane emissions from the 2015 Aliso Canyon blowout in Los Angeles, CA • The airborne data show that 97,100 metric tons of methane were released to the atmosphere (only 3% of the total volume!) • Derived flow rate is highly correlated with reservoir pressure, which was monitored continuously by SoCalGas throughout the leak • These data provide robust constraints on flow rate for the majority of the event • These data further provide a “prior” estimate for inverse model studies using ground-based, airborne, or orbital sensors
Aliso Canyon in perspective • Equal to the annually -averaged leak rate from all other CH 4 sources in the Los Angeles Basin combined (Peischl et al. , JGR , 2013) • Largest single -point accidental CH 4 release in U.S. history • Significant on the scale of California emissions reduction efforts mandated under the Global Warming Solutions Act of 2006 (AB32) • “Mitigation of the climate effect” of Aliso Canyon methane, as promised by SoCalGas, will take a substantial effort
Aliso Canyon in bigger perspective • The climate impact of Aliso Canyon AR5 radiative forcing U.S. total CH 4 is dwarfed by routine emissions CH 4 emissions from oil & gas, agriculture, & landfills other landfills coal mining • The climate impact of CH 4 emissions (aside from its SLCF role) is dwarfed by livestock & agriculture routine emissions of CO 2 energy sector • Avoiding future natural gas blowouts U.S. EPA inventory data is good, but their complete absence won’t address any major climate issue COP21 agreements include specific requirements for the Parties to account for anthropogenic GHG emissions with “accuracy and completeness” Suggests a robust and complementary observational and analysis system is needed to quantify emissions across a breadth of spatial and temporal scales
GHG emissions monitoring and attribution requires a continuum of data Targeted mobile Long-term surface Long-term column observations observations observations Point and area source Area, regional, and global Area, regional, and global snapshots; incident response source monitoring source monitoring NASA OCO-2 NOAA cooperative sampling network Research aircraft JAXA/NIES/MOE GOSAT Mobile laboratories INFLUX Megacities Carbon Project TCCON (Indianapolis, IN) (Los Angeles, CA)
Recommend
More recommend