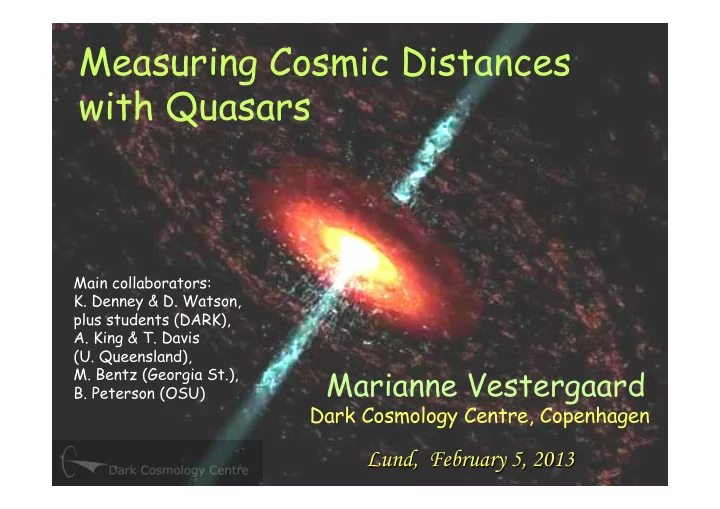

Measuring Cosmic Distances with Quasars Main collaborators: K. Denney & D. Watson, plus students (DARK), A. King & T. Davis (U. Queensland), Marianne Vestergaard M. Bentz (Georgia St.), B. Peterson (OSU) Dark Cosmology Centre, Copenhagen Lund, February 5, 2013
Basic Quasar Structure Edge-on Face-on Broad Emission Line Black hole Gas (“clouds”) Fast-moving gas (Accretion) Torus: Dust+Gas, IR emission Accretion Disk: gas, continuum emission (X-ray, UV, optical) 13
Quasars as Cosmic Distance Indicators • Standard Candles 16 photons L F = 4 ! d 2 New Standard candle: The “BLR size” of AGN
Black Hole Virial Mass M BH = v 2 R /G Edge-on Face-on It takes time for light to travel to the BEL gas from the accretion disk Broad Emission Line Gas (“clouds”) Fast moving gas - ionized by photons from accretion disk BH We can measure this time delay (or distance) with variability studies R BLR = c τ Accretion Disk: gas, continuum emission (X-ray, UV, optical) 13
AGN Virial Mass Estimates M BH = v 2 R BLR /G • Variability • Radius – Luminosity Studies: R BLR =c τ Relation: Flux H β Flux cont Continuum L 2 Delay, τ R 2 Emission line L 1 R 1 t + τ τ t
The Radius-Luminosity Relationship Plot courtesy Misty Bentz • Physics behind the photo-ionization responsible for broad line emission dictates R ~ L 0.5 • This ‘nebular physics’ is well understood. • Supported by recent calibrations from ‘lags’ = R BLR /c • This implies: AGNs can be used as “standard candles” !!
Quasars as Cosmic Distance Indicators L 2 > L 1 L 2 R 2 R BLR = c τ R 2 > R 1 L 1 R 1 R d ¡~ ¡τ/F 1/2 ¡ L L( λ ) = F( λ ) 4 π d 2 (Watson, Denney, Vestergaard, Davis, 2011, ApJ, 740, L49)
AGN Hubble Diagram: Recession Velocity vs Distance Black holes as distance indicators 13
The SNe Hubble Diagram What is the current status of SNe? – 583 SNe – Standardizable 569 SNe light-curves Union2 SNe Compilation – Corrections for Amanullah et al. (2010) host galaxy type, dust, photometric calibration, etc – z-binning?
The SNe Hubble Diagram What is the current status of SNe? – 583 SNe – Standardizable light-curves Union2 SNe Compilation – Corrections for Amanullah et al. (2010) host galaxy type, dust, photometric calibration, etc 583 SNe – z-binning? Union2.1 SNe Compilation Suzuki et al. (2011) RMS is larger at z > 0.4 – this is where AGN can help
SNe Took a While to Catch on too. • SNe Results: – Amanullah et al. 2010 (ApJ 716, 712) – Suzuki et al. 2012 (ApJ, 746, 85) • They were 10 years ago where we are now… • Look how far they’ve Amanullah et al. (2010) come! • RMS ~ 0.2 mag Suzuki+ 2012 14 0.19±0.04
The AGN Hubble Diagram Reduce the Scatter: Luminosity Distance (Mpc) RM Lag / AGN Flux 0.5 – Misidentified Lags – Reddening/dust Corrections (e.g. Crenshaw ‘01) – Multiple measurements of individual objects All data: 1 σ scatter = 0.5mag Residuals (dex) Residuals (mag) SNe: 1 σ = 0.2 mag; Redshift Best data: 0.12 mag (Watson, Denney, Vestergaard, Davis, 2011, ApJ, 740, L49)
With the most recent updates, the RMS scatter Most recent update is already only ~0.33 mag !! And we can do better. Additional datapoints Scatter: 0.13 dex • Improved flux errors + Galactic reddening (all data) • Additional and improved corrections for host galaxy light corrections Bentz et al. 2013, ApJ, submitted
A significant error is inaccurate distances to the Most recent update nearby objects not in the Hubble flow. The good news: This is CORRECTABLE! Scatter: 0.13 dex • Improved flux errors + Galactic reddening (all data) • Additional and improved corrections for host galaxy light corrections Bentz et al. 2013, ApJ, submitted
Is the Cosmological Constant “constant”? • Time dependence of w, w(z) = w 0 + w a ( 1 - ( 1 + z) - 1 ) • Best probed at high z • AGNs have the clear advantage here: — Exist at all z — Do not dim with time — Can be re-observed — Targets can be selected: The power of AGNs ü At certain redshifts ü With minimal reddening ü With favorable properties (variability amplitude, strong lines)
The Potential Power of AGNs W a W 0 W 0 With knowledge of Ω (matter) Marginalized over Ω (matter) Complementary to SNe, CMB, and BAO
Figure of Merit: W 0 – W a plane SNe incl. AGN Factor 2 Factor 30 increase increase SNe+BAO+CMB AGN alone BAO As function of the maximum cut-off redshift of AGN sample
Summary • We can determine the size of the broad line emitting region R(BLR) near the black hole from light travel time delays. Traditionally, R is used for BH mass estimates. • R(BLR) can be used to determine cosmological distances because this size correlates tightly with the quasar nuclear luminosity: R ~ L 0.5 • Scatter (~0.5mag) needs to be reduced (to < 0.2mag) , but outlook is good for AGNs to help constrain w and especially w a better than any other method to date. The current scatter is ~0.33 mag The power of AGNs (over SNe) is at z > 1 • If we apply the same resources to RM as has been to SNe, we can take this far -> testing DE onset?
Recommend
More recommend