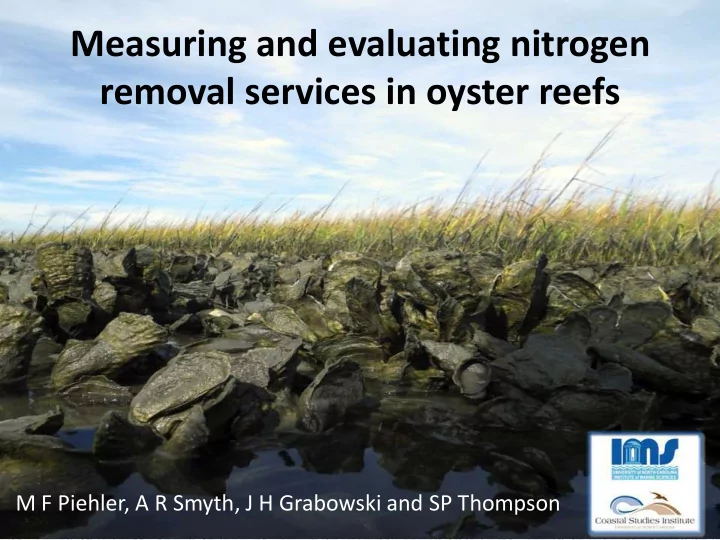

Measuring and evaluating nitrogen removal services in oyster reefs M F Piehler, A R Smyth, J H Grabowski and SP Thompson
Consequences of oyster habitat degradation Filtration Stabilization Habitat Loss of ecosystem goods and services
Habitat degradation tends to reduce habitat complexity Simple Habitats Complex Habitats
Grabowski et al. (2012) Bioscience
Oyster reefs may help resist eutrophication
Illustration by AR Joyner and HW Paerl
Piehler and Smyth 2011, Ecosphere
“Indeed, a man would have to eat sixteen dozen of these acephalous molluscs in order to gain the 315 grammes of nitrogen he requires daily.” Jules Verne, 'Twenty Thousand Leagues Under the Sea’
Oyster Reef Denitrification and Landscape Position How does landscape setting affect oyster reef denitrification? Control Oyster reefs Mudflat Mudflat + Reef Marsh Marsh + Reef Seagrass + Marsh+ Seagrass + Marsh Reef
Oyster Reef Landscape Position And Denitrification Control + Reef 250 200 ( μmol N-N 2 m -2 hr -1 ) Denitrification 150 * 100 50 0 Mudflat Marsh SAV + Marsh Seagrass + Habitat Setting Marsh
Oyster Reef Landscape Position And Denitrification Response to increased nutrient loading 600 Control Control + Nitrate + Reef + Reef + Nitrate 500 * ( μmol N-N 2 m -2 hr -1 ) 400 * * Denitrification 300 200 100 0 Mudflat Marsh SAV + Marsh Seagrass + Marsh Habitat Setting
Biotic and Abiotic Denitrification Results from sediment flux experiment 350 No difference in rates between weeks C 300 Average Percent Increase Shell: 24% ( μmol N-N 2 m -2 hr -1 ) Live: 61% 250 Denitrification B Rates similar to 200 other oyster reefs A and mud flats in 150 area during summer. 100 50 0 Control Shell Live Treatment N=8, Wilcoxon
Evaluating estuarine N processing • Rigorous measurements of processes • Net contributions to N processing • Transferable data $1300 $1600 $800 $200 All values are dollars per hectare per year $1600
What does estuarine N removal cost?
Where to next?
Invaluable contributions…
Many thanks…
Recommend
More recommend