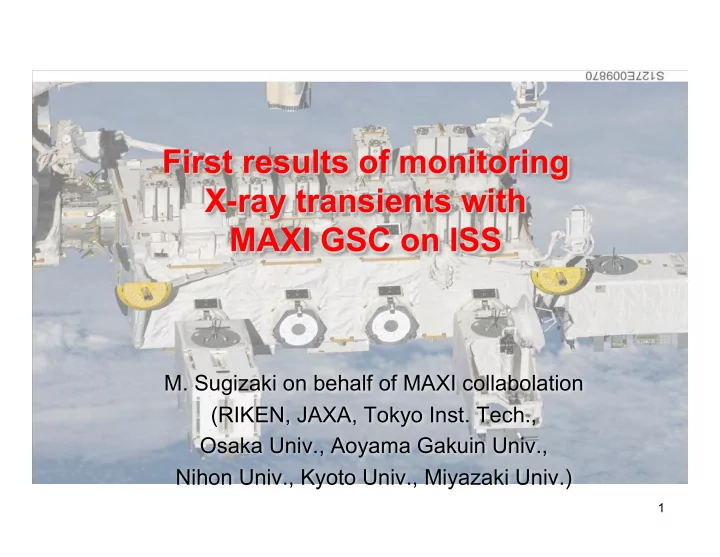

M. Sugizaki on behalf of MAXI collabolation (RIKEN, JAXA, Tokyo Inst. Tech., Osaka Univ., Aoyama Gakuin Univ., Nihon Univ., Kyoto Univ., Miyazaki Univ.) 1
MAXI Team • RIKEN: T.Mihara, M.Sugizaki, M.Kohama, Y.Nakagawa, T.Yamamoto • JAXA : M.Matsuoka, K.Kawasaki, S.Ueno, H.Tomida, M.Suzuki, Y.Adachi, M.Ishikawa, Y.Itamoto, H.Katayama, K.Ebisawa • Tokyo Inst. Tech. : N.Kawai, M.Morii, K.Sugimori • Osaka Univ.: H.Tsunemi, M.Kimura • Aoyama Gakuin Univ.: A.Yoshida, K.Yamaoka, S.Nakahira, I.Takahashi • Nihon Univ. : H.Negoro, M.Nakajima, S.Miyoshi, R.Ishiwata, H.Ozawa • Kyoto Univ.: Y.Ueda, N.Isobe, S.Eguchi, K.Hiroi • Miyazaki Univ.: M.Yamauchi, A.Daikyuj 2
MAXI Mission on ISS • X-ray all-sky monitor on ISS • Transported by Space Shuttle STS-127 on July 16, 2009 • Installed on JEM (Japanese Experiment Module) EF (Exposed Facility) on July 23. • Commissioning started on Aug 3. MAXI JEM EF • First light image on Aug 15. ISS orbit and particle count-rate map orbit inclination = 51.6 deg. See P5 – 211 (Kawai) for mission overview 3
Field of Views Gas Slit Camera (GSC) on MAXI Scan with ISS rota8on Slit Slat Collimator 1.5 deg (FWHM) 160 deg PSF beam size Energy band: 2-30 keV ~ 1.5x1.5 deg. 4 Celestial sphere
GSC sky coverage 2009/10/25 Solar- protection 1 orbit scan area (90 min.) Scan- rotation axis Aurora, SAA (high- radiation) area 1 day coverage > 95% per day 5
Daily all-sky image (Aug.15-Oct.28 movie) • Axis of rotation moves due to the precession of the ISS orbit by 44 days. • Dead area for solar protection is reduced from 15 deg. to 5 deg. during the commissioning operation. 6
2 -month image (Sep 1– Oct 22, 2009) MAXI GSC Red (2–4 keV), G (4–8 keV), B (8–16 keV) no background subtraction, not corrected for exposure
Comparison with HEAO A-1 ~A about 160 sources visible by the eye. Some of the bright sources not in the HEAO A-1 catalog are marked with circles.
Crab Nebula: 2-month Light Curve 56 days 2009-08-15 2009-10-10 • 1 bin = 90 min = 1 orbit scan • Effective area variation is corrected (but not perfect). • systematic errors ~ 5% 9
Crab Nebula: Image and Spectrum 1-day data (8/15) Crab 2 keV 30keV . g Preliminary spectral fit e d 6 1 1. normalization, power-law index: OK A0535+62 2. N H (low-energy absorption): needs calibration PSF FWHM ~ 1.5 deg. 10
Flare of UX Ari (an RS CVn star) 2009-09-05 2009-09-06 Sep 06, 2009 peak flux ≈ 50 mCrab duration ≤ 1 day GSC 3-10 keV Preliminary 10mCrab 11
XTE J1752-223 (new black hole candidate) 2009-10-22 2009-10-24 2009-10-27 RXTE detection MAXI detection flux (mCrab) Preliminary 0 1 2 3 4 5 6 (days) XTE J1752-223 is a new black hole candidate discovered on 2009-10-23 at 19:55 (UT) with the RXTE/PCA scan (ATEL#2258, Markwardt et al. ). MAXI recorded its flux since the onset of the outburst, preceding the first RXTE detection. 12
Bright Galactic X-ray Binaries (1) GRS1915+105 GSC 3-10 keV 90 min/bin Preliminary 1 Crab 0 Cyg X-3 0.5 Crab Periodicity by 4.8-h orbital period 0 13
Bright Galactic X-ray Binaries (2) Cyg X-2 1 Crab GSC 3-10 keV 90 min/bin Preliminary 0 Cyg X-1 0.5 Crab 0 14
Galactic X-ray variables Cen X-3 GSC 3-10 keV 90 min/bin Preliminary 0.5 Crab 0 Her X-1 • Eclipse by 1.7-day orbital period • 35-day activity period 0.1 Crab 0 15
AGN Cen A 50 mCrab GSC 3-10 keV 1 day/bin 0 Preliminary Mkn 421 50 mCrab GSC 3-10 keV 1 day/bin 0 Preliminary 16
Current Status • Hardware – 8 (out of 12) GSC cameras are operational in regions with low particle flux ( ~50% of orbits) . • 2 GSC cameras had high voltage breakdown • 2 more GSCs have similar symptoms • Sensitivity – 20 mCrab/scan, 5 mCrab/day, 1 mCrab/week (goals) – achieved: somewhat lower due to high background, limited live time (< 50%), and insufficient calibration • Calibrations: under progress – alignment and position encoding: PSF and localization accuracy to be improved – energy response • Software pipeline : under testing – “Nova Search”: under testing – Light curves: in preparation . 17
Summary • MAXI started observation in August 2009, currently in the commissioning phase • Achieving <10 mCrab sensitivity per day • Performance somewhat compromised due to high particle flux and operation constraints on the ISS • Instrument calibration, background study, and data processing pipeline are under progress. • Distribution of light curves of monitored sources starting in December 2009 at http://maxi.riken.jp/ . • Transient/nova alert distribution planned to start in Dec or Jan. • Contact us for including your favorite sources in the monitor list. • Cooperative works with other wavelength missions, which include Fermi, will be helpful to study high-energy transient phenomena. • See poster P5 – 211 (Kawai) for mission overview, other science topics including X-ray bursts, GRBs. 18
Backup 19
Exposure for a single target Coverage: Effective area 45 sec. x 2 / 90 minutes time variation ~ 1.7% for a position 1 orbit = 90 min. on the sky 15 orbits per day 1 day Sun 100 days SAA Detector boundaries 20
Image Response design Sco X-1 in 1 scan Transmission of collimator FWHM =1.5 degree. Wire Scan direction direction Scan direction Crab and A0535+26 sep=4.5 deg 1 day acc. Crab and A0535+26 1 day acc. Crab Position A0535+26 resolution of 1-D position sensitive counter Wire dir. FWHM ~1.5 degree g ] e d 1 . 0 [ A R 15 20 25 21
ISS orbit and event-rate map i = 51.6 22
Recommend
More recommend