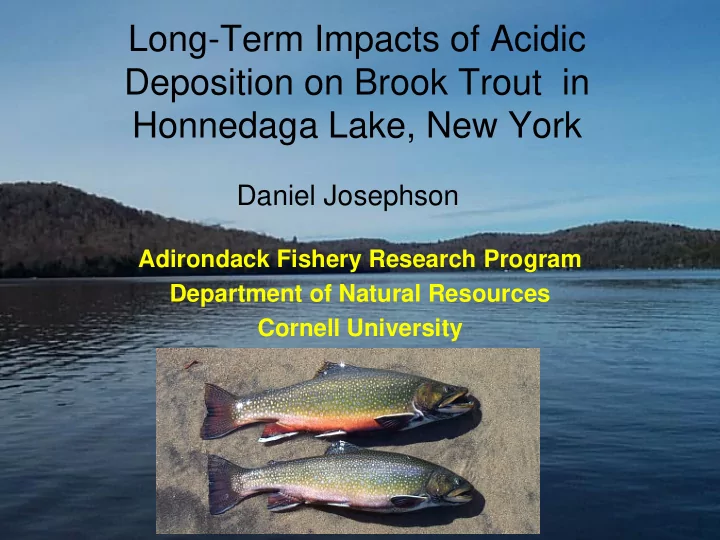

Long-Term Impacts of Acidic Deposition on Brook Trout in Honnedaga Lake, New York Daniel Josephson Adirondack Fishery Research Program Department of Natural Resources Cornell University
Colleagues and Cooperators Co-Authors: Justin Chiotti, Kurt Jirka, Jason Robinson, Cliff Kraft Kraft Lab Group – Peter Stevens, Graduate Students, and Technicians Adirondack League Club Volunteers USGS RPI – Keck Lab NYS DEC
Honnedaga Lake Surface Area : 312 ha (770 acres) Max Depth : 56 m (183 feet) Elevation : 701 m (2300 feet)
Historical Honnedaga Lake Fish Community Composition Prior to 1890 1930 to 1955 Brook Trout Brook Trout Lake Trout (I) 1890-1930 Brook Trout 1955 to Present Lake Trout ( I ) Brook Trout Round Whitefish ( I ) White Sucker ( I ) ( I ) - Introduced Creek Chub ( I ) Source : Webster 1961
Historical Honnedaga Lake Fish Community & Acidic Deposition 1890 1910 1930 1950 1970 1990 2010
Water Chemistry Surveys
Historical Honnedaga Lake Fish Community & Lake Surface pH 7 6 5 4 1890 1910 1930 1950 1970 1990 2010 1890 1910 1930 1950 1970 1990 2010
Honnedaga Lake Inorganic Monomeric Aluminum 350 LETHAL Monomeric Aluminum (ug/L) 300 250 200 150 100 50 NON-LETHAL 0 1980 1990 2000 2010
Honnedaga Lake Brook Trout Lake Surface Water Chemistry 6 5 SO 4 (mg/L) 4 3 2 1 0 1975 1980 1985 1990 1995 2000 2005 2010 5.5 pH 5.0 4.5 1975 1980 1985 1990 1995 2000 2005 2010 250 200 im (ug/L) 150 100 Al 50 0 1975 1980 1985 1990 1995 2000 2005 2010
Honnedaga Lake Tributaries
pH in Honnedaga Lake Tributaries – Summer (2009) Mean pH < 5.0 Mean pH > 5.0
Fall Trapnet Surveys : Lake Assessments
Fall Trapnet CPUE of Brook Trout 140 30 120 25 CPUE (n/night) 20 100 15 CPUE (n/night) 10 80 5 0 60 1970s 2000s 40 20 0 1955 1958 1961 1964 1967 1970 1973 1976 1979 1982 1985 1988 1991 1994 1997 2000 2003 2006 No Trap Net Surveys
Brook Trout Redd Surveys and Spawning Habitat Measurements
Documented Brook Trout Spawning Sites (since 2000) Lake Shoal Tributary Mean pH < 5.0 Mean pH > 5.0
Annual Brook Trout Redd Counts 90 80 70 Redd Count (n) 60 50 40 30 20 10 0 2001 2003 2004 2005 2006 2007 2008
pH Measurements within Redds and Adjacent Lake & Tributaries 7 Lake or Trib 6 pH Redd 1 Redd 2 5 4 T4 T8 T8 East Shore T9 Trib Trib Shoal Shoal Trib
Stream Electro-fishing Surveys : Lake Assessments
Honnedaga Lake Tributaries
Young-of-Year Brook Trout and Al im in Tributaries Presence / Absence Density Y P < 0.05 2 = 0.65 YOY Brook Trout Presence (Y/N) R 0.7 0.7 ) ) 2 2 m m / / 0.6 0.6 r r e e b b m m u u 0.5 0.5 n n ( ( E E U U N 0.4 0.4 P P C C 0 50 100 150 200 250 24 24 t t Inorganic Monomeric Aluminum (micrograms/L) u u 0.3 0.3 o o 22 22 r r Temperature Temperature T T 20 20 k k 0.2 0.2 o o o o 18 18 r r B B 0.1 0.1 16 16 Y Y O O Y Y 14 14 0.0 0.0 0 0 50 50 100 100 150 150 12 12 200 200 250 250 Al im (micrograms/L) Al im (micrograms/L)
Summary Since 1990 Amendments to the Clean Air Act A modest chemical and brook trout population recovery within Honnedaga Lake Continued chronic acidification of numerous groundwater influenced tributaries within the watershed The acid impaired state of tributaries likely limits young-of-year and consequently adult brook trout abundance
Recommend
More recommend