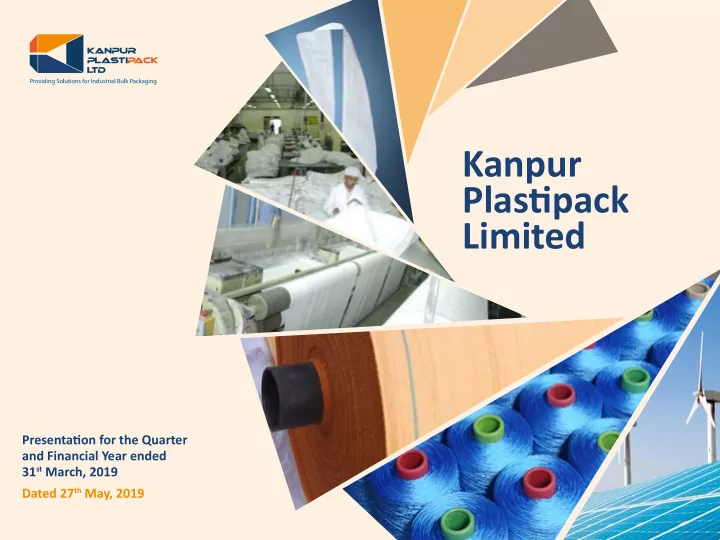

Kanpur Plastjpack Limited Presentatjon for the Quarter and Financial Year ended 31 st March, 2019 Dated 27 th May, 2019
ABOUT US 2 Kanpur Plastjpack Ltd. is engaged in the manufacturing and export of Flexible Intermediate Bulk Container (FIBC), Woven Sacks and Polypropylene (PP) high tenacity Multjfjlament Yarn. We have leveraged our 48 years of experience to evolve into providing end-to-end industrial bulk packaging solutjon to our customers globally. We have expanded our footprints in several internatjonal markets, having presence in around 40 countries.
WHAT DO WE STAND FOR? 3 Kanpur Plastjpack Limited is commitued to produce and supply products as per customer’s requirement. We ensure contjnual improvement of the quality management systems. We believe in increasing the value of our company and our global portgolio by exceeding customers’ expectatjons and achieving market leadership.
QUARTER ON QUARTER ANALYSIS 4 Partjculars Q4 FY 2019 Q3 FY 2019 Growth Net Sales 7889.53 ( H in Lakhs) 9146.53 ( H in Lakhs) 13.74 (in %) PBT 349.73 ( H in Lakhs) 619.24 ( H in Lakhs) 43.52 (in %) PAT 269.03 ( H in Lakhs) 462.80 ( H in Lakhs) 41.87 (in %) EBITDA 9.41 (in %) 10.44 (in %) 9.87 (in %) Margin EPS 1.90 (in H ) 3.25 (in H ) 41.54 (in %)
YEAR ON YEAR QUARTERLY ANALYSIS 5 Partjculars Q4 FY 2019 Q4 FY 2018 Growth Net Sales 7889.53 ( H in Lakhs) 7362.42 ( H in Lakhs) 7.16 (in %) 349.73 ( H in Lakhs) 827.40 ( H in Lakhs) 57.73 (in %) PBT 269.03 ( H in Lakhs) 584.40 ( H in Lakhs) 53.96 (in %) PAT 1.90 (in H ) 4.83 (in H ) 60.66 (in %) EPS
FULL YEAR ANALYSIS 6 Partjculars FY 2018-19 FY 2017-18 Growth Net Sales 32314.47 ( H in Lakhs) 27853.55 ( H in Lakhs) 16.02 (in %) PBT 2166.10 ( H in Lakhs) 2434.73 ( H in Lakhs) 11.03 (in %) PAT 1620.12 ( H in Lakhs) 1592.13 ( H in Lakhs) 1.76 (in %) EBITDA 10.15 (in %) 10.93 (in %) 7.14 (in %) Margin EPS 11.65 (in H ) 13.36 (in H ) 12.80 (in %) Note: Figures of the previous year have been regrouped/rearranged/recasted wherever found necessary.
KEY RATIOS 7 Partjculars FY 2019 FY 2018 EPS 11.65 ( H per share) 13.36 ( H per share) 1.33 (in tjmes) 1.33 (in tjmes) Current Ratjo 0.52 (in tjmes) 0.33 (in tjmes) Debt-Equity Ratjo Debt Service 2.65 (in tjmes) 3.65 (in tjmes) Coverage Ratjo Total Outstanding 4.48 (in tjmes) 3.65 (in tjmes) Liability to EBITDA 10.15 (in %) 10.93 (in %) EBDITA Margin
KEY FACTORS 8 Profjtability of the Company was afgected primarily due to increased allocatjon of depreciatjon on the new CAPEX as well as higher fjnance cost. Increased competjtjon, global downturn and increased capacitjes have afgected the performance and also put pressure on margins. During the year the Green fjeld project was completed and the Company has inaugurated unit no. 3 at Gajner Road on 20th of July, 2018. Massive refurbishment exercise has also been undertaken at unit no. 1 at Registered Offjce of the Company to streamline the layout and enhance longevity of the building and structure. FY 2018-19 was a year in transitjon and your Company had invested for superior infrastructure and increased capacitjes.
ROAD AHEAD 9 Leveraging our strong customer relatjonship to expand our geographical presence Enhanced and Superior structuring of manufacturing capabilitjes to meet the additjonal demand in the packing industry Technological upgradatjon and innovatjon as the key areas. Diversify our revenue stream by exploring new geographies and penetrate the existjng markets. Multj-fjlament yarn becoming an independent strong vertjcal in the Company. Your company is now all set to utjlize its improved infrastructure and increased capacitjes for betuer results in the coming years.
THANK YOU D 19-20, Panki Industrial Area, Kanpur 208 022 Tel: +91 512 2691113 - 116 Fax: + 91 512 2691117 Email: secretary@kanplas.com CIN: L25209UP1971PLC003444 www.kanplas.com
Recommend
More recommend