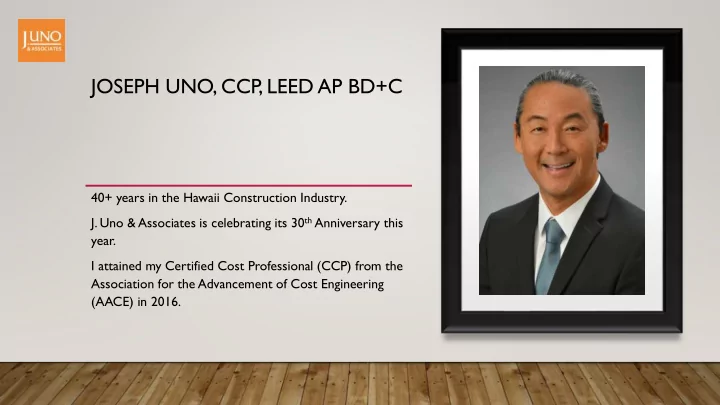

JOSEPH UNO, CCP, LEED AP BD+C 40+ years in the Hawaii Construction Industry. J. Uno & Associates is celebrating its 30 th Anniversary this year. I attained my Certified Cost Professional (CCP) from the Association for the Advancement of Cost Engineering (AACE) in 2016.
APPRAISAL INSTITUTE OF HAWAII Good Data, Incomplete Conclusions. Why Area Cost Factors just don't seem to work well here
THE PROBLEM • USE OF NATIONAL CONSTRUCTION COST DATABASES WITH AREA COST As cost estimators, we FACTORS FOR HAWAII PRODUCE consistently see inadequate budgets set by the use of INVALID CONCLUSIONS Area Cost Factors applied to National Cost Databases.
MY RESEARCH My Technical Paper, “T esting the Reliability and Validity of Area Cost Factors in Hawaii”
THE SOURCES I looked into how these National sources develop their factors
ENGINEERING NEWS RECORD – MATERIALS • ADD PHOTO O • 57 Materials • 20 City Average • ENR factor is 1.38 • Hawaii is 2.038.
ENGINEERING NEWS RECORD - LABOR • 22 construction trades • 20 City Average ENR factor is 1.38 • Hawaii wages are 1.210 •
RSMEANS - MATERIALS • 65 items R.S. Means Key Materials List. 30 Cities • RSMeans Index is 1.250 • • Hawaii factor is 2.026
RSMEANS - LABOR • 18 Construction Trades 30 cities • • RSMeans City Cost Index for Labor is 1.197. Hawaii factor is 1.254 •
STUDENT HOUSING – FROM “ARCHITECT’S SQUARE FOOT COST BOOK – 2015” • Maryland $93.51/s.f. • ENR factor is 1.38 • Adjusted to Hawaii = $129.04/s.f..
UH HILO STUDENT HOUSING - 2013 • UH Hilo for $232.31/s.f. • $232.31/$93.51 = 2.48
ENR SQUARE FOOT COST BOOK - 2015 $41.47/s.f.. • • ENR factor is 1.38 Adjusted to Hawaii • would be $57.23/s.f..
SCHOFIELD BARRACKS PARKING STRUCTURE - 2017 • Built in 2016-17 for $29,330,000 $134.60/s.f.. • $134.60/$41.47 = 3.25. •
REPLACEMENT COST ESTIMATES • We quantify building elements • Price using Current and Historical Cost Data,
2018 J. Uno COMPARISONS Building Replacement Values $/SF Cost J. Uno $/SF $3,375,906 $168.80 $9,783,000 $489.15 $12,991,953 $166.78 $29,058,000 $373.02 COMPARISON OF OUR $5,996,287 $166.56 $10,914,000 $303.17 REPLACEMENT COST ESTIMATES FOUND A $6,995,667 $166.56 $10,701,000 $254.79 DIFFERENCE OF $50,000,000!!! $8,312,191 $159.85 $27,162,000 $522.35 $37,672,004 $165.30 $87,618,000 $384.46
CONCLUSIONS • While National Databases and their Location Adjustment Factors are Reliable (producing consistent results), they are not necessarily Valid . • This is important because, along with Income Q&A and Sales , Cost is the third leg of the appraisal methodology. • Use of Replacement Cost Estimates may provide more accurate and valid cost data.
Recommend
More recommend