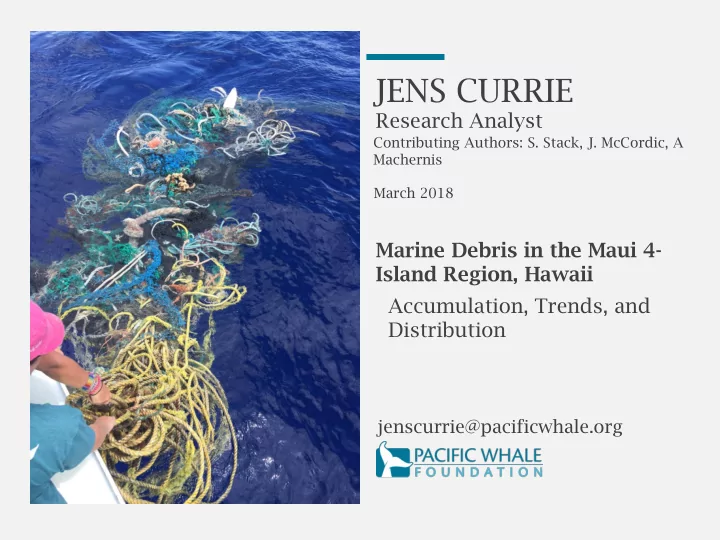

JENS CURRIE Research Analyst Contributing Authors: S. Stack, J. McCordic, A Machernis March 2018 Marine Debris in the Maui 4- Island Region, Hawaii Accumulation, Trends, and Distribution jenscurrie@pacificwhale.org
The Maui 4-island region STUDY AREA Surrounded by Maui, Moloka’i , Lana’i , and Kaho’olawe . Within the Hawaiian Islands Humpback Whale National Marine Sanctuary. Recreation, tourism, endangered marine species overlap.
Marine debris hotspot A CONSERVATION CONCERN Within the subtropical convergence zone. The Hawaiian archipelago is subject to high debris loads, receiving >52 metric tons/year. NOAA PIFSC, Coral Reef Ecosystem Program Accumulation is the result of a multistep process. Origin of Hawaii’s debris varies greatly.
Understanding Marine Debris in Maui QUANTIFYING TYPES AND TRENDS Work to document the rate and process of marine debris accumulation in the Maui 4-island region. Boat-based marine debris data collection minimal.
Data collection OCEAN SURVEYS All debris items sighted during surveys were collected: GPS location – Type of material (category) – % biofouling (coverage) – Photograph – We later determined: Origin of item (land, ocean, – or unknown) Country of origin (where – possible)
260 Days at sea APRIL 2013 – OCTOBER 2017 Removed and documented 2,118 items of debris. Surveyed 38,269.86 km.
Marine Debris almost everywhere POTENTIAL CONVERGENCE ZONE Quantified the number of items per km 2 ,and standardized data for effort. Highest encounter rate observed was 7.96 items per km of effort. Densities were highest where the Au'au, Kealaikahiki, and Alalakeiki channels meet.
Seasonality of marine debris MAY and NOV peaks Density for May more than twice that of all months except November. 0.18 Density (count/effort/km 2 ) 0.16 0.14 0.12 0.10 0.08 0.06 0.04 0.02 0.00 Jan Feb Mar Apr May Jun July Aug Sep Oct Nov Dec Month
Yearly accumulation trends 2017 PEAK Debris density was 219 % greater in 2017 than the next highest year. 0.2 Density (count/effort/km 2 ) 0.18 0.16 0.14 0.12 0.1 0.08 0.06 0.04 0.02 0 2013 2014 2015 2016 2017 Year
Higher density with depth INCREASING TREND 0.18 Density (count/effort/km 2 ) 0.16 0.14 0.12 0.1 0.08 0.06 0.04 0.02 0 0-50 50-100 100-150 150-200 200-250 250-300 Depth (m) Linear mixed-effects model: Estimate: 0.0003; t-value: 3.335097; p-value: 0.0009 Minimal sampling beyond 300m.
Identifying origins MOSTLY AN UNKNOWN Land Ocean 7% 12% Land: 30 % Balloons (n = 40) Unknown 81% Ocean Items: 41 % Buoys (n = 105) 13 % Nets (n=36) 11% Fishing Gear (n = 29) Unknown: 14 % Styrofoam (n = 245) 0.3 % Single use plastic bags (n=5)
Identifying types A PLASTIC OCEAN We found an average of 1.5 items of plastic per km 2 within study area. Plastic 90% Fabric/Cloth Glass Metal Other Plastic Processed Lumber Rubber
Identifying types THE REMAINING 211 ITEMS Processed Lumber: 40 % paper/cardboard (n = 23) 42 % pieces of wood (n=24) Glass Metal 8% 14% Other Fabric/Cloth 9% Rubber: 17% 65 % balloon/latex material (n = 32) 28 % recreational gear (n=14) Processed Lumber Rubber 28% 24% Fabric/Cloth: 22 % hats/clothing (n=8)
Country of origin 41 ITEMS IDENTIFIED China, Japan, and the rest of Asia account ~49% of worldwide plastic production. China is 1 of the 5 top countries where more than half of land-based waste originates. 50% 40% 30% 20% 10% 0% Japan China Korea other
Biofouling by debris type FACTOR OF TIME? Average Biofoul Coverage (%) 40 35 30 Plastics, glass, and 25 fabric/cloth have 20 similar average 15 biofouling coverage. 10 5 0 Fabric/Cloth Glass Metal Other Plastic Processed Rubber Lumber Category 160% Fabric/Cloth 140% Glass 120% Soak time may play a Plastic 100% role in percent Frequency 80% surface area covered 60% with biofouling. 40% 20% 0% Biofoul Coverage (%)
What did we learn? SUMMARY Debris accumulation hotspot within the Maui 4-island region. Peak densities occur in May and November. Significant increase in debris accumulation observed in 2017. Depth plays a role in debris accumulation trends. We found positive examples of successful mitigation measures and data to support upcoming legislation.
Acknowledgements THANKS TO ALL WHO WORKED ON PROJECT Co-authors PWF members and supporters Stephanie Stack Jessica McCordic Who provided the funds for the Abigail Machernis project Research interns from 2013-2017 Thank you for listening
Recommend
More recommend