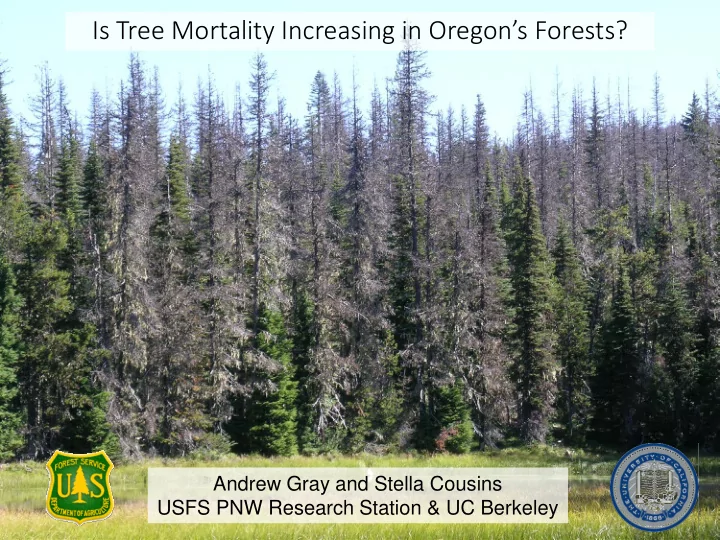

Is Tree Mortality Increasing in Oregon’s Forests? Andrew Gray and Stella Cousins USFS PNW Research Station & UC Berkeley
Outline What is background mortality? What are the patterns of tree mortality over the last decade? What is driving mortality in Oregon’s forests? How does this compare with the previous decade?
Mortality and tree density Stand Age High density Sparse density Low density 10 60 120
Mortality and stand development 10,000 9,000 8,000 7,000 Volume (ft3/ac) 6,000 Total volume 5,000 4,000 3,000 2,000 1,000 0 0 50 100 150 200 Stand age 180 Gross growth 160 Mortality 140 Volume rate (ft3/ac/yr) Annual Net growth 120 components 100 of change 80 60 40 20 0 0 50 100 150 200 Stand Age
The strategic inventory of Oregon’s forests
- Representative sample The power of the FIA plot grid: - Consistent protocols - Multiple data attributes - Permanent plots - Plot confidentiality
The big picture for Oregon Acres of forestland: 29,195,481 N trees Volume (million) Percent (million ft3) Percent Live 9,674 98,882 Mortality / yr 171 1.8% 699 0.7% Cut / yr 40 0.4% 1,052 1.1% Overstory / yr 53 1.2% 571 0.7% Understory / yr 118 2.4% 128 1.4% Net growth / yr 1,015 1.0%
Mortality and ownership
Causes of mortality
How prevalent is disturbance? Disturbance Area (1000 ac)SE Percent Percent/yr Cut 3,477.6 152.4 11.9% 1.2% Fire 1,026.1 81.4 3.5% 0.4% Cut + Fire 161.1 33.9 0.6% 0.1% 2.0%/yr Insect or Disease 4,100.5 148.3 14.0% 1.4% Weather 524.0 62.9 1.8% 0.2% Incidental Cut 373.7 56.3 1.3% 0.1% None 19,532.4 254.0 66.9% Total 29,195.5 182.9
Area by fire severity class, OR/WA NFS ~45% of area burned in fire was moderate or severe (>60% overstory mortality) For Ecol Mgmt 359: 199
Timing and cause of mortality
Mortality volume (%) by watershed
Net change volume (%)
Net change volume (%) no fire or cutting
Mortality in the 90s + 00s on NFS 95% CI 95% CI Component Means 90s 90s Mean 00s 00s Growth 1.73% 0.04% 2.01% 0.06% Mortality -1.11% 0.07% -0.87% 0.07% Cut -0.12% 0.03% -0.16% 0.03% Net change 0.50% 0.08% 0.98% 0.10%
Clearly mortality events happen... Sierra in drought Whitebark pine in Wind Rivers
Species change in the 90s on NFS All stands Unburned stands PICO TABR2 PIEN PICO PIMO3 ABLA PIEN ARME PIAL TABR2 ABLA ARME PIAL PIMO3 Lintz 2016, Ecol. Ind. 66: 1 Big losers: madrone, whitebark pine, white pine, subalpine fir, yew, Engelmann spruce, lodgepole
Species change in the 00s on NFS Unburned stands All stands TSHE PSME PIMO3 PSME THPL PIPO CHCHC4 PIEN 4 PISI PIMO3 THPL ARME PIPO 4 ABCO PISI ACMA3 LAOC QUCH2 JUOC ACMA3 ARME Change in live volume/yr (%) CADE27 LAOC ABCO Change in live volume/yr (%) PIEN CHLA QUCH2 CADE27 CHLA TSME CHNO 2 JUOC ABLA 2 CHNO TSME CONU4 PILA QUKE CONU4 PILA POBAT PIJE PIJE TABR2 POBAT ABLA QUKE TABR2 0 0 PIAL BEPA -2 PIAL -2 BEPA -4 -4 -4 -2 0 2 4 -4 -2 0 2 4 Change in number of trees/yr (%) Change in number of trees/yr (%) Losers: paper birch, whitebark pine; dogwood + sugar pine losing numbers but gaining volume.
Species migration on the west coast Opportunity to follow-up with ingrowth and mortality Monleon & Lintz, 2015. Plos One
Conclusions Background mortality is a concept with limited utility Most tree mortality in Oregon is from insects, disease, suppression, and other, with relatively little due to fire. Quite different from California Mortality has decreased on National Forests from the 90s to 00s, though declines in whitebark pine continue. Lodgepole, white pine, and subalpine fir appear to be recovering.
Thank you!
Recommend
More recommend