
Ionospheric Disturbances Observed with the VLA Low-band Ionospheric and Transient Experiment (VLITE) Presented by Joe Helmboldt (Naval Research Laboratory) May 12, 2015 On behalf of the VLITE team: N. Kassim, T. Clarke, W. Peters, S. Giacintucci, T. Mroczkowski, E. Polisensky, P. Ray, J. Deneva, and B. Hicks
Introduction NRL Remote Sensing and Space Science Divisions with the National Radio Astronomy Observatory (NRAO) have developed, implemented, and commissioned a new backend for the Very Large Array (VLA) in New Mexico. Exploits unique feature of the optical design to continuously capture and process signals at P-band (320-384 MHz). Our scientific goals are to study the dynamics of Earth’s ionosphere and to search for and characterize cosmic transient emitters. Uses dedicated signal processing/analysis and imaging pipelines that run in (near) real time and offline using archived data. Highest-level ionospheric data products are temporal and spatial fluctuation spectra of total electron content (TEC) gradient.
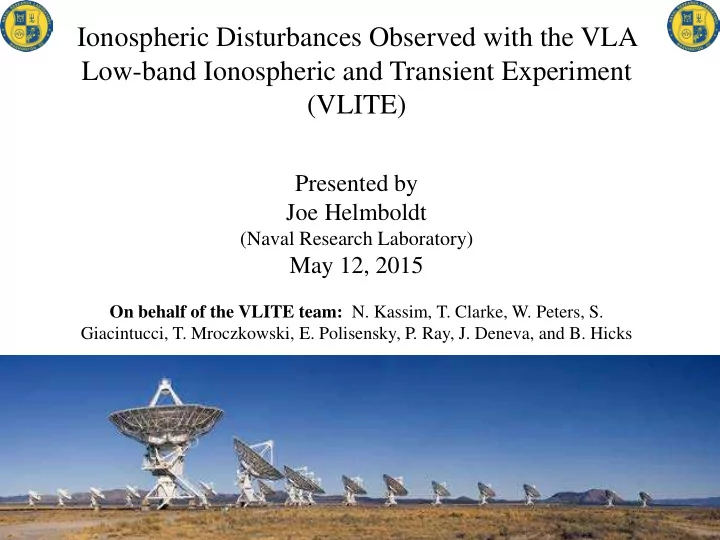
VLITE VLA used to have two relatively narrow low-frequency bands at 74 and 330 MHz. Were decommission during VLA upgrade starting in 2009. New upgraded P-band system developed and commissioned with NRL’s help; has 10 times the bandwidth (224—480 MHz). New 74 MHz system in development/testing phase; uses “box”-mounted, modified J-poles to reduce aperture blockage. Building on this success, NRL funded new VLITE project. VLITE exploits separate low- and mid/high-frequency “optics” to continuously record, process, and image at one low-frequency band (350 MHz) using 10 VLA antennas over three-year period. image courtesy of NRAO/AUI
Ionospheric Remote Sensing with the VLA Interferometers simultaneously observe celestial sources and ionospheric structure Effect of the ionosphere ~ν -1 VHF interferometers are excellent probes of find-scale structure Measure differential TEC to precision as good as 10 -4 TECU; translates to TEC gradient precision ~2×10 -4 TECU km -1 . Schematic of observations through the ionosphere (not to scale). 4
VLITE Pipeline: Signal Processing Baseline phases have other contributions besides ionosphere, including cosmic source structure, instrumental response, telescope pointing errors, troposphere, and noise. Signal processing mitigates these, except troposphere; rely on VLA monitoring system to flag times when troposphere too active. Baseline phases from observation of extremely bright source, Cygnus A, with the full VLA P-band system (uses 16×16-MHz sub-bands). Shows contributions from delay errors, source structure, and ionosphere. Lower panel shows de-trending (w/ linear fits) and baseline calibration remove non-ionospheric contributions from VLITE data.
VLITE Pipeline: Processing & Analysis Raw phases; 4 (a) (b) sub-bands , 2 De-trend, polarizations convert to δTEC , and combine (d) (c) Fluctuation spectra Polynomial fit converts δTECs to antenna- based TEC gradients.
VLITE Pipeline: GPS Analysis Complementary pipeline runs daily on 24-hours of GPS data from 20 stations within 200 km of VLA; performs similar 3-D spectral analysis. Simultaneous VLITE/GPS detection of localized TID. Daily GPS spectra from GPS station pipeline layout near the VLA.
Example Science: Impact of a Solar Flare VLITE was observing bright source (3C84) before, during, and after solar flare on 12 March 2015. “Drift-scan” image of TEC gradient VLITE spectrogram w/ GPS data & spectrum of HF skywave (WWV @10 MHz) Spatial frequency spectral maps at 0.0078 Hz VLITE observations during last of 4 M-class flares that occurred on 12 March 2015.
Summary VLITE started science operations in November 2014. Have some exciting initial results, but have only just begun. Building a large repository of fluctuation spectra for statistical/climatological analysis; including value-added data from GPS, Boulder digisonde, seismic station in Albuquerque, GOES satellite (solar X-rays), and antarctic cosmic ray monitors to constrain nature of fine-scale fluctuations. Preliminary results from past few months (VLA B-config. Feb.-May.) suggest higher-frequency fluctuations (>0.1 Hz) dominated by thermospheric turbulence; lower frequency regime likely has significant gravity-wave contribution. But, it’s early days yet; stay tuned . . .
Recommend
More recommend