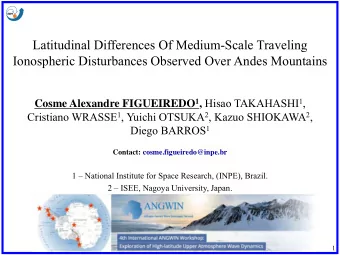
ANGWIN Workshop 2018, INPE São José dos Campos, SP, Brazil Ionospheric dynamics over South America observed by TEC mapping H. Takahashi, C. M. Wrasse, C. A. O. B. Figueiredo, D. Barros, M. A. Abdu (INPE, Brazil), Y. Otsuka and K. Shiokawa (ISEE, Nagoya University, Japan)
Contents: 1. OH Temperature measurement at King George Is. 2. GNSS Groundbased receiver network 3. Equatorial ionization Anomaly (EIA) 4. Equatorial Plasma Bubbles (EPBs) 5. Medium scale travelling Ionospheric Disturbances (MSTIDs) 6. Geomagnetic storm event
OH Temperature measurements at King Georg Is. Year 2001-2005
Fotantar 1: 2001 – 2003 Fotantar-2: 2004
Tilting filter photometer: FOTANTAR -1 Measurement of atmospheric temperature at 85~90 km altitude Using OH(8-3) band P branch 2,5 o Alojamento do filtro Filtro M 1 Lente Colimador M 2 Disco de calibração interno Diafragma Fotomultiplicadora PMT PAD AT Freq Controle Micro
Fotantar 1 at Ferras Station (62 S, 58 W): Feb. 2001
Seasonal variation Nightly-averaged OH temperature 240 OH(8-3) OH(8-3) data Temperature (K) OH(8-3) 220 OH(6-2) 200 180 160 Fotan Fotantar -1 tar -2 140 2001 2004 2002 2003 Year MSIS-90 model
Planetary waves during July to August 2002, observed in the stratospheric ozone layer. Nightly-averaged OH temperature 240 OH(8-3) OH(8-3) data Temperature (K) OH(8-3) 220 OH(6-2) 200 180 160 140 2001 2004 2002 2003 Year MSIS-90 model
TOH Comparison, C. Ferraz vs. Davis 2001 and 2002 C. Ferraz, Temperature via OH(8-3) - year 2001 C. Ferraz, Temperature via OH(8-3) - year 2002 240 230 Temperature (K) 220 210 200 190 Annual Mean = 216 +- 10 K Annual Mean = 210 +- 13 K 180 0 50 100 150 200 250 300 350 0 50 100 150 200 250 300 350 Day of Year Day of Year Davis, Temperature via OH(6-2), year 2001 Davis, Temperature via OH(6-2), Year 2002 240 230 Temperature (K) 220 210 200 190 Annual Mean = 203 +- 9 Annual Mean = 205 +- 10 180 0 50 100 150 200 250 300 350 0 50 100 150 200 250 300 350 Day of Year Day of Year Temperatura média noturna
Photo taken by Dr. Ricardo, 02 June 2002 10
FOTANTAR-3 2005-2009
FOTANTAR-3 Espectro-Imageador, FOTANTAR-3 20 cm OH (6-2) Rotational lines: P 1 (2) P 2 (3) P 1 (3) P 2 (4) P 1 (4) (Å): 8399 8415 8430 8452 8465 40 cm 2 1 1 0 2 2 STL-1001E Class 1 Cour urtesy tesy of (SBIG), 1024 x 1024, 20 m Bageston eston PROANTAR REDE 1 Monitoramento da temperatura mesosférica
METODOLOGIA (1) 2 (simetria azimutal) sinal dark noise d J J r ( ) 0 P 1 (4) P 1 (3) P 1 (2) P 2 (4) P 2 (3)
Resultados: comparação com o modelo MSISE-90 02 Set. 2005 13 Set. 2005 04/05/2018 17:11 14/19
Groundbased GNSS receiver network in South America and TEC Mapping
GN GNSS SS gr grou oundb ndbased ased ne netwo work rk ov over er So Sout uth h Am Amer erica In total, there are ~150 sites RBMC(Brazilian) IGS(International) RAMSAC(Argentine) LISN(BU)
TECMAP over South America Spatial resolution : 50 to 500 km depending on the density of observation points. Temporal resolution : 10 minutes Dot: ionosphere pierce point (at 350 km altitude), Color shade: TECu from 0-30 (blue) to 70-80 (red)
1. Equatorial Ionization Anomaly: EIA • Large day to day variability • Difficulty to preview location of EIA
TECMAP: 2018 March 23 – 30, at fixed time 23:00 UT 2018 03 25 2018 03 26 2018 03 24 2018 03 23 Symmetric to Magnetic equator EIA only the southern part 2018 03 29 2018 03 30 2018 03 27 2018 03 28 No EIA cresta
2. Equatorial Plasma Bubbles • Development of EPB from the sunset to mid- night. (video) (Feb. 15, 2014), • Day to day variability of activity (Feb. 2014), • Bubble – No Bubble – Bubble (Jan. 3-5, 2015)
Plasma Bubble development: Example: 2014 Feb. 15/16, 22:00 03:00 UT, development of several bubbles. 9
Plasma bubbles: Seeding and development Example: 2014 Feb. 15-16 Dashed line: solar terminator at 110 km altitude 7
Periodic bubble structures observed in 2014 February 10 to 17 (02:00 UT fixed) Feb. 11 Feb. 12 Feb. 13 Feb. 10 Feb. 15 Feb. 16 Feb. 14 Feb. 17
Day to day variability of EPB occurrence 2015 01 04 2015 01 05 2015 01 03 23:00 UT 23:00 UT 23:00 UT Bubbles No Bubbles Bubbles
MSTID Event • Case study 2015_03_08 (video) • dTEC keogram to calculate, MSTID wavelength, period, phase velocity and propagation direction
MSTID: dTEC Map: 2015_03_08 dTEC(t) = TEC(t) - <TEC(t -/+ 30 min.)> dTEC Map: 2015_03_08, at 22-23 UT
MSTID: dTEC Map: 2015_03_08 dTEC Map: 22-23 UT Keogram Latitudinal (15 – 30 S) variability of dTEC at 45 W MSTID Charac. When (UT) Horiz.-WL Period Phase Direction 22 – 23 UT 760 km 22 min. 570 m/s North
MSTID: Medium Scale Travelling Ionospheric Disturbance Characteristics: 1. Observed time: Mostly from afternoon to evening time zone, 2. Horizontal wavelength: 100 – 1000 km 3. Period: 15 – 60 minutes 4. Phase velocity: 100 – 300 m/s
Seasonal variations of occurrence EPB activity: MSTID activity: Same day occurrence of MSTID and EPB
EPB and MSTID occurrence in 2014-2015
TECMAP during the Geomagnetic Storm
Large day to day variability with geomagnetic storm 2015 March 17 – 20, 01:00 UT fixed March 17 March 18 March 19 March 20 (d) (c) (b) (a)
Storm Event: 2015 03 17 (St. Patrick day storm)
Nighttime LSTID at 23:00 UT dTEC maps of the Southern (C and D) hemisphere observed during the period of 23:00- 23:20 UT on March 17, 2015. The LSTID propagates Northwestward. The black continuous line is the magnetic equator. The arrows indicate the direction of propagation of LSTID.
LSTID at 23:00 UT dTEC maps of the Northern (A and B) hemisphere observed during the period of 23:00- 23:20 UT on March 17, 2015. These images shows LSTIDs propagating southwestward. The arrows indicate the direction of propagation of LSTID.
Discussions: Auroral activity at NH and SH The horizontal geomagnetic field (H) component (Figure A) along the northern (Husafell) and southern (Syowa) auroral regions on March 17, 2015. The difference between Husafell and Syowa Tsugawa et al. [2006] suggested that the period and the wavelength of LSTIDs should be dependent on a priori condition of the source in the auroral region. Valladares et al. [2009] attributed the difference on auroral currents between the NH and SH polar regions.
Discussion: Conjugate Points Temporal variations of dTEC at conjugate points in NH and SH. Three regions in SH (30.0 ° S, 27.5 ° S and 22.5 ° S) and NH (16.75 ° N, 14.90 ° N and 30.11 ° N) are selected.
Summary Usefullness of TECMAP and dTEC map to monitor the ionospheric weather: Day to day variability of EIA, Day to day variability of EPB, Occurrence of MSTID in the ionosphere, Response of the ionosphere against geomagnetis Strom.
Abstract: • Equatorial Plasma Bubbles (EPBs) and Medium Scale Travelling Ionospheric Disturbances (MSTIDs) have been monitored by Total Electron Content Map (TECMAP) observed by ground based GNSS (Global Navigation satellite System) receiver networks in South America. We observed that daytime MSTIDs are frequent during the period from March to September while EPBs are frequent during the period of September to March, just in an opposite phase in each other. Investigating the same day occurrence of MSTID and EPBs, however, we found that there is a close relation between the inter- bubble distance and horizontal wavelength of MSTID, suggesting contribution of MSTID in generating the EPBs. TECMAPs during intense geomagnetic storms revealed latitudinal propagation modes of Large Scale Travelling Ionospheric Disturbance (LSTID) and non-symmetric propagation feature between the Northern and southern hemispheres.
Comparação do Instrumento SABER com o FotAntar-3 • Dados Obtidos para os meses de Julho, Agosto e Setembro de 2005; • Total de dados bons do Fotantar-3 para comparação: 52 noites; 04/05/2018 17:11 40/19
Recommend
More recommend
Unleash a World of Digital Possibilities—Browse, Share, and Explore Content Without Boundaries