Investigation of Anisotropy in the Woodford Shale AVAZ and Rock - PowerPoint PPT Presentation
Investigation of Anisotropy in the Woodford Shale AVAZ and Rock Physics Modeling in the Anadarko Basin, OK Alexander Lamb Outline Background Well Log Observations Seismic Data Observations Rock Physics Modeling Synthetic
Investigation of Anisotropy in the Woodford Shale AVAZ and Rock Physics Modeling in the Anadarko Basin, OK Alexander Lamb
Outline • Background • Well Log Observations • Seismic Data Observations • Rock Physics Modeling • Synthetic Seismic Data • Results / Conclusions
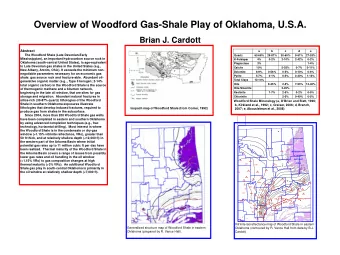
Background • Woodford Shale Formation • Anadarko Basin • Canadian County, OK
Background • Woodford Shale § “Black” shale § Late Devonian / Early Mississippian § ~13,000 ft. deep § ~250 ft. thick • Mississippian Limestone above • Hunton Limestone below
Well Log Data
Anisotropy VTI HTI [from Tatham et al., 1992]
Well Log Data – VTI?
Well Log Data • Well Log Observations indicate VTI • Considerations § Higher frequency of log data (2-10kHz) § Limited resolution • What does seismic data tell us?
Seismic Data - AVAZ • Amplitude varying with azimuth • Does AVO response change as a function of azimuth? • Necessary to use pre-stack data • Key indicator of HTI
Seismic Data - Workflow • Tie well log to seismic data • Interpret Woodford horizon • Gather seismic data by azimuth (10 degree sections) • Convert from offset gathers to angle gathers • Calculate AVO gradient (B) as a function of azimuth
Seismic Data - Workflow Gather Seismic Data Convert offset gathers into angle into Azimuthal (10 gathers (from Hampson-Russell) degree) sections
Quantifying AVO • RC ( θ ) = A + B sin 2 θ
Quantifying AVO • RC ( θ ) = A + B sin 2 θ
AVAZ Results • Interpret B as a function of azimuth
AVAZ Results AVO Gradient as a Function of Azimuth 1.5 1.0 0.5 AVO Gradient 0.0 -0.5 -1.0 -1.5 -2.0
AVAZ Results • Graph results of B on polar plot • Fit ellipse to data • Minor axis points to orientation • Minor/major axis ratio indicates fracture density
AVAZ Results • Graph results of B on polar plot • Fit ellipse to data • Minor axis points to orientation • Minor/major axis ratio indicates fracture density
Seismic Data • Seismic Observations indicate HTI • Longer wavelengths ‘sample’ more rock, better for volumetric properties • Relative fracture density from AVAZ • Quantify fracture density?
Rock Physics - Workflow • Composite Estimate § Created from well log data • Hashin-Shtrikman-Walpole Bounds § Introduce Porosity • Hudson Cracked Media Model § Introduce fractures • Brown and Karringa Fluid Saturation § Add fluids
Rock Physics - Composition
Rock Physics Minerals Introduced Φ K 0, µ 0 K 1, µ 1 HSW bounds • From composition, created isotropic model of Woodford • Hashin-Shtrikman-Walpole bounds show effect of porosity ( Φ ) on stiffnesses (K, µ) • New density-porosity used
Rock Physics Introduced Φ Introduced cracks K 1, µ 1 C ij dry Hudson Model • Porous media inserted into Hudson Cracked Media Model • Specific crack density and aspect ratio used • Crack density governed by • Stiffness tensor C ij dry returned
Rock Physics BK Fluid Introduced cracks Introduced fluid Saturation C ij dry C ij • Cracked model inserted into Brown and Karringa fluid saturation method • Fluid determined by water/gas mixture governed by S w log • Stiffness tensor C ij returned
Rock Physics - Recap • Composite Estimate § Created from well log data • Hashin-Shtrikman-Walpole Bounds § Introduce Porosity • Hudson Cracked Media Model § Introduce fractures • Brown and Karringa Fluid Saturation § Add fluids • Result: C ij
Synthetic Seismic Data • From rock physics model: C ij • ANIVEC software generates synthetics • In progress: Perform AVAZ on synthetics to determine relationship between ellipticity and crack density
Results / Conclusions • Well log data indicates VTI • Seismic data indicates HTI • Preliminary AVAZ results from seismic data show a SW/NE orientation • Rock physics model based on well log data generates full stiffness tensor usable for synthetics
Future Work • Establish quantified relationship between crack density and ellipticity • Regional map of fracture orientation from AVAZ methods on seismic data • Quantify effect of varying lithology
Special Thanks to our Sponsors
Questions? Thanks for listening!
Recommend


More recommend
Explore More Topics
Stay informed with curated content and fresh updates.