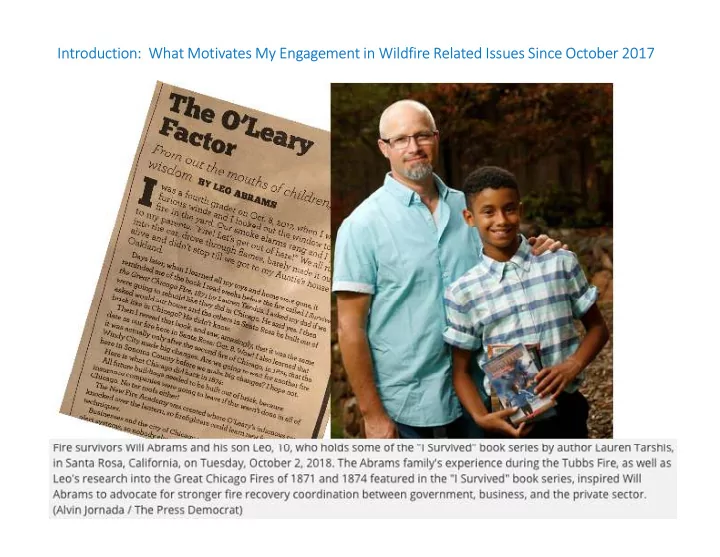

Introduction: What Motivates My Eng ngagement in n Wildfire Related Issues Since October 2017
Critical Inflection Point: Collaborate on n Solutions and Performance Outcomes for Mutual Benefit or Compete for Dwindling Fi Financial Resources 1. Shared Objectives: Market Predictability (consumer rates & investor return), Reduced Risks (financial & safety) Greater Efficiency (streamlined processes, maximize public/private investment) 2. Shared Risk Factors a) External - Climate Change, Economic Uncertainty, Insurance Scarcity b) Internal – Infrastructure, tools and processes not adapted to New Normal (residential building code, utility grid, vegetation/land-management practices, political processes, regulatory framework, etc.) 3. High Propensity for Action: business and resident aligned interests increase political viability Bankruptcy Process OR Mid/Long Short Term Term Lose Win Recent Legislation Win Lose Lose Win Regulatory Framework 2
Wildfire Mitigation Governing Principle in my filed comments was reiterated by Governor Newsom and Represented as top pr priority in n Strike Force Report… “Establish a More Rigorous WMP Process: The WMP requirements should be revised to include a section on long-term fire management and a process to ensure faster compliance with the proposed plan. WMPs should also include specific performance- based risk mitigation metrics that are independently and scientifically verified as well as cost-effective. Further, to hold IOUs accountable, California should consider putting in place an auditing system tied to financial incentives.” 3
Example: Methodology for Ensuring Measured Risk Reduction Across a System What strategic pl planning tools are us used to di distill, qu quantify and pr prioritize goals/objectives TQM Provides interdependent thresholds and levers for effective regulation 4
Example: standardize reports to inform the de development of pe performance-based metrics Wind Speed (Beaufort Wind Scale) Breeze Gale Storm Switch X 0.23 0.34 0.79 Tree Species Y 0.01 0.02 0.25 Transformer Z 0.3 0.3 0.88 X and Y +0.11 +0.24 +0.43 X and Z +0.02 +0.02 +0.02 X, Y and Z +0.62 +0.65 +0.73 Relative Risk Context Key 0.8 1 = High Confidence 0.6 = Medium Confidence 1 0.4 = Low Confidence 1 0.2 CI 0 = High LOE MTTR = Medium LOE = Low LOE 5 0-0.2 0.2-0.4 0.4-0.6 0.6-0.8
What strategic pl planning tools are us used to di distill, qu quantify and pr prioritize goals/objectives Example: How Return-On-Safety (ROS) can dr drive Corporate Culture Gives Managers tools to measure Key Performance Indicators (KPIs) Provides Leadership and Policy Makers Easy Assessment Scorecards of Key Initiatives to hold stakeholders accountable Gives residents confidence that programs and policies are being implemented effectively 6
Recommend
More recommend