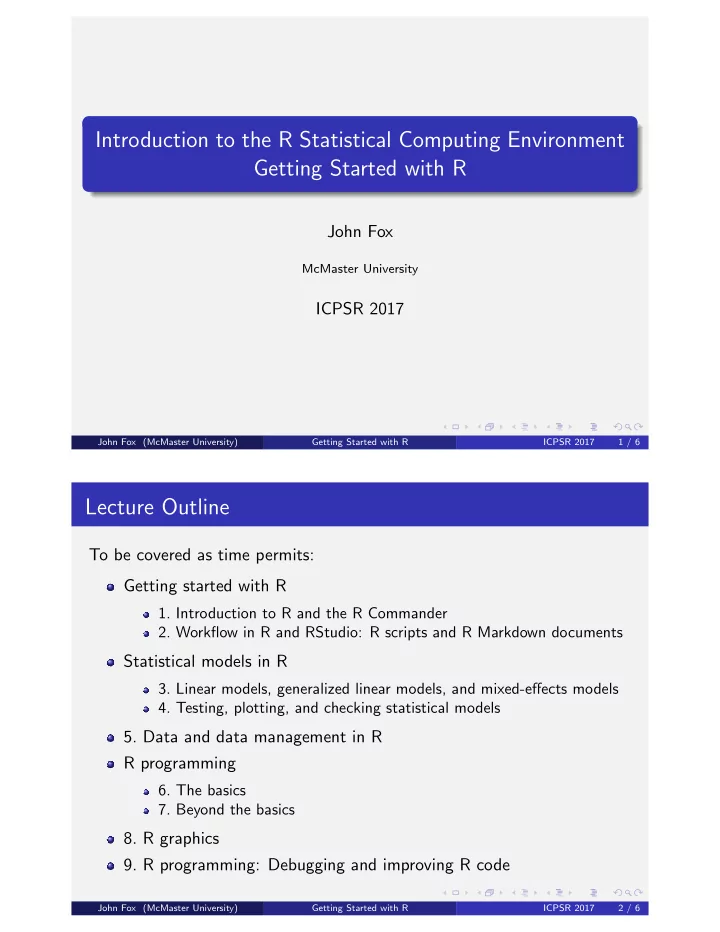

Introduction to the R Statistical Computing Environment Getting Started with R John Fox McMaster University ICPSR 2017 John Fox (McMaster University) Getting Started with R ICPSR 2017 1 / 6 Lecture Outline To be covered as time permits: Getting started with R 1. Introduction to R and the R Commander 2. Workflow in R and RStudio: R scripts and R Markdown documents Statistical models in R 3. Linear models, generalized linear models, and mixed-effects models 4. Testing, plotting, and checking statistical models 5. Data and data management in R R programming 6. The basics 7. Beyond the basics 8. R graphics 9. R programming: Debugging and improving R code John Fox (McMaster University) Getting Started with R ICPSR 2017 2 / 6
Getting Started With R What is R? A statistical programming language and computing environment, implementing and extending the S language. Two implementations of S: S-PLUS: commercial, for Windows and (some) Unix/Linux, eclipsed by R. R: free, open-source, for Windows, Mac OS X, and (most) Unix/Linux. John Fox (McMaster University) Getting Started with R ICPSR 2017 3 / 6 Getting Started With R What is R? How does a statistical programming environment differ from a statistical package (such as SPSS)? A package is oriented toward combining instructions and rectangular datasets to produce (voluminous) printouts and graphs. Routine, standard data analysis is easy; innovation or nonstandard analysis is hard or impossible. Card-reader/line-printer model of statistical computing. A programming environment is oriented toward transforming one data structure into another. Programming environments such as R are extensible . Standard data analysis is easy, but so are innovation and nonstandard analysis. Conversational model of statistical computing. John Fox (McMaster University) Getting Started with R ICPSR 2017 4 / 6
Getting Started With R Why Use R? Among statisticians, R has become the de-facto standard language for creating statistical software. Consequently, new statistical methods are often first implemented in R. There is a great deal of built-in statistical functionality in R, and many (literally thousands of) add-on packages available that extend the basic functionality. R creates fine statistical graphs with relatively little effort. The R language is very well designed and finely tuned for writing statistical applications. (Much) R software is of very high quality. R is easy to use (for a programming language). R is free (in both of senses: costless and distributed under the Free Software Foundation’s GPL). The RStudio editor/IDE makes it easy to use R for programming, package development and, routine data analysis, including writing reports with embedded R code, for reproducible research. John Fox (McMaster University) Getting Started with R ICPSR 2017 5 / 6 Getting Started With R This Lecture Series The purpose of this lecture series is to get participants started using R. The statistical content is largely assumed known. Much of the lecture series is based on J. Fox and S. Weisberg, An R Companion to Applied Regression, Second Edition , Sage (2011), and on-line appendices. A third edition is in the works. More advanced participants may prefer to read, or want to read in addition, W. N. Venables and B. D. Ripley, Modern Applied Statistics with S, Fourth Edition . New York: Springer, 2002 — somewhat out of date but still useful. Additional materials, references, and links are available on the web sites for the lecture series and the book: http://tinyurl.com/ICPSR-R-course and http://tinyurl.com/carbook John Fox (McMaster University) Getting Started with R ICPSR 2017 6 / 6
Recommend
More recommend