
Information Security Identification and authentication Advanced - PowerPoint PPT Presentation
Information Security Identification and authentication Advanced User Authentication II 2016-01-29 Amund Hunstad Guest Lecturer, amund@foi.se Agenda for lecture I within this part of the course Background Authentication eID
Information Security Identification and authentication Advanced User Authentication II 2016-01-29 Amund Hunstad Guest Lecturer, amund@foi.se
Agenda for lecture I within this part of the course Background Authentication ✔ eID ✔ Statistics in user authentication ePassports ✔ Biometrics in general ✔ Biometric systems Tokens Fumy, W. and Paeschke, M. Handbook of eID Security A. Jain, A. Ross and K. Nandakumar, Chapters 1 in "Introduction to Biometrics" 2
Agenda for lecture II within this part of the course Background Statistics in user authentication Statistics Generic biometric system Biometric systems Design cycle (Multibiometrics ,in lecture III ) Tokens Security threats (Attacks ,in lecture III ) A. Jain, A. Ross and K. Nandakumar, Chapters 1, 6 & 7 in "Introduction to Biometrics" 3
Biometrics, definition "The automated use of physiological or behavioural characteristics to determine or verify identity” Bio from Greek life Metric from Greek measurement In this case we measure Physical properties of the user’s body Behaviour properties of the user 4
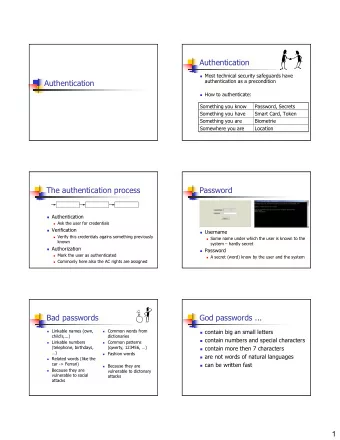
User authentication/identification Can in an IT system be achieved via What I know – passwords, PIN What I have – ID-cards, smart-card, token What I am/do – biometrics Identification Authentication 5
Biometrics, examples Written signature Retinal scan DNA Vein pattern Thermal pattern of the face Keystroke dynamics Finger prints Face geometry Hand geometry Iris pattern Voice Ear shape Body motion patterns 6
7
Matching, decision regions, hypothesis testing A typical system has a threshold parameter which determines the allowed variance Statistical theory for hypothesis testing enables analysis It is necessary to balance user population statistics against intended use More about this … 8
Statistics in user authentication Problems and unexpected effects 9
Statistics in user authentication For identification, you must consider the probabilities that two persons ever have matching authentication data For verification, you must estimate the probability that an impostor can guess a victim’s parameter value and imitate it 10
Statistics in biometrics A typical system has a threshold parameter which determines the allowed variance Use statistical theory for hypothesis testing Balance user population statistics against intended use plus importance of each of the CIA criteria, and set thresholds accordingly 11
Failure rates Admitting a person under the wrong identity FAR – False Acceptance Rate, also called FMR – False Match Rate Rejecting a person claiming correct identity FRR – False Rejection Rate, also called FNMR – False Non-Match Rate 12
Failure rate effects Remember: Admitting a person under the wrong identity means damaged Confidentiality and/or Integrity Rejecting a person claiming correct identity means damaged Availability 13
Identification effects Hypothesis testing answers “True” or “False” Hypothesis can be “this is person X” Highly unbalanced in the sense that most subjects are not person X Creates effects that surprise some 14
Identity testing problems Suppose there are 10,000 persons on a “no fly” list An airport uses identification devices with FAR=0,1% and FRR=5%. Reasonable values? A terrorist has a 5% chance of getting aboard. Send 20 and one will succeed A typical airport like Arlanda ( ≈ 50 000 passengers per day) will detain 50 innocent people each day 15
Traps in using FRR False Rejection Rate is a mean value over a trial population It does not (necessarily) give the general probability that a given user is rejected Usually there is a subset of users who get most of the rejections It is not valid for users deliberately trying not to be recognised 16
Conditional v mean values If the correct user is often rejected due to anomalies, attempts at false acceptance as that user may fail often and vice versa. This distorts “true” values If the attacker knows the statistics of single users, the most likely victim can be chosen 17
Example 1 A user population has two sets of users, X with excellent characteristics for the biometric system and Y with bad characteristics. 1% belong to Y A user from X has FAR 0.5% A user from Y has FAR 50% Total FAR ≈ 1% An attack deliberately at a Y person still has 50% probability of succeeding 18
Example 2 A user population has two sets of users, X with good characteristics for the biometric system and Y with bad characteristics. 1% belong to Y A user from X has FRR 0.5% A user from Y has FRR 50% Total FRR ≈ 1% (looks good, you must re-authenticate only once for every 100 attempts on the average) Users from Y must re-authenticate every other time when using the system. And they must make three attempts one out of four times etc. 19
General statistics How large is the set of possible values? Are some more likely than others? How large is the user population? How many guessing attempts can be made per time unit? Are there restrictions on the possible number of attempts against the same user? Are there general restrictions on the number of attempts? 20
Illustration example, card PIN A card PIN has 10,000 possible values The probability to guess a PIN in the usually allowed three consecutive attempts is thus only one in more than 3000 If 3500 cards are stolen each year, at least one misuse through correctly guessed PIN should be expected per year With 5000 stolen cards, it is more likely that one of them gets its PIN guessed in the first attempt, than that none gets that effect 21
Remember Balance risks against population characteristics, like size but not only size Average risks can be much higher for subsets of users than for the total population If one single customer is hit, it does not matter to that customer that the average risk per customer was very low If some customers are at high risk, the organisation is bound to get hit eventually 22
Generic biometric system: Building blocks 24
Feature extraction: Segmentation and enhancement 25
Generic biometric system: Building blocks 26
A generic biometric system Sensor Data reduction Classification Measurement data Input signal Desicion areas and confidence levels Feature vector 4454 43534 90234 09824 94995 89235 Person: Pelle 0934 32846 94535 65251 34656 13455 Confidence level: 84% 9834 36004 02543 88984 04848 23905 9843 98489 42894 88940 82389 78377 2134 98988 97873 13300 12083 09399 4390 93289 90139 03290 83893 88389 1247 27
Classification Person B Person A Person D Person C 28
Design cycle of biometric systems 29
Design cycle of biometric systems Nature of application Cooperative users • Overt/covert deployment • Habituated/Non- • habituated users Attended/Unattended • operation Controlled/Uncontrolled • operation Open/Closed system • 30
Design cycle of biometric systems Choice of biometric trait Universality • Uniqueness • Permanence • Measurability • (Collectability) Performance • Acceptability • Circumvention • 31
Requirements on biometric traits Attempt to classify methods according to how they meet all seven criteria. Valid today? Do you agree in general? Look closely and make your own assessment! There is no “correct” answer… 32
Design cycle of biometric systems Collecting biometric data Appropriate sensors • Size, cost, ruggedness, high • quality biometric samples Collection environment • Sample population • Representative of the • population Exhibit realistic intra-class • variations User habituation • Legal, privacy & ethical • issues 33
Design cycle of biometric systems Choice of features/matching algorithm Prior knowledge of the • biometric trait Uniqueness • Mimic human ability to • discriminate Interoperability between • biometric systems Common data exchange • formats … 34
Design cycle of biometric systems Evaluation of biometric systems Technology evaluation • Scenario evaluation • Operational evaluation • Error rates • System reliability, availability, • maintainability Vulnerabilities • User acceptability • Cost, throughput, benefits • Return on investment • 35
How to cheat a biometric system? Cheat the sensor Picture of another persons face Voice recordings ... Cheat the system False user permission Intrude/manipulate communication ... 36
What are the disadvantages of biometric systems Sensors of low quality and sensitive to noise Biometrical features needs to be uniqe Temporal variations (ageing, beards, weight etc…) complicates the use 37
Security threats: Denial-of-service (DoS) Legitimate users are prevented from obtaining access to the system or resource that they are entitled to Violates availability 38
Security threats: Intrusion An unauthorized user gains illegitimate access to the system Affects integrity of the biometric system 39
Security threats: Repudiation A legitimate user denies using the system after having accessed it. Corrupt users may deny their actions by claiming that illegitimate users could have intruded the system using their identity 40
Recommend


More recommend
Explore More Topics
Stay informed with curated content and fresh updates.