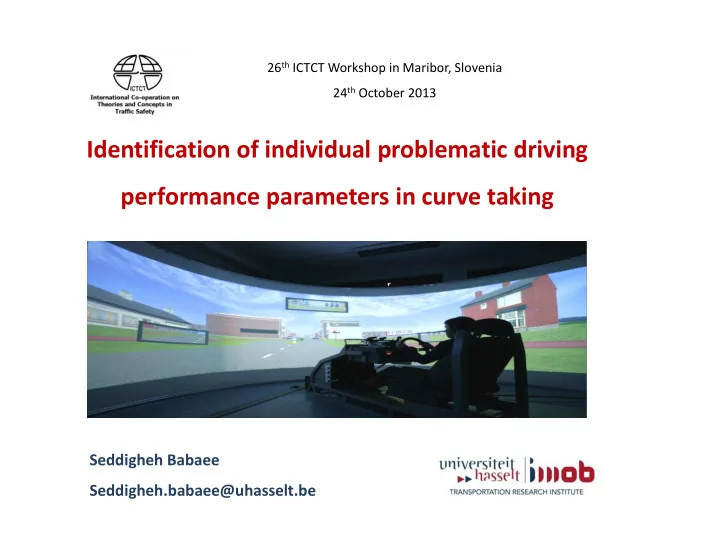

26 th ICTCT Workshop in Maribor, Slovenia 24 th October 2013 Identification of individual problematic driving performance parameters in curve taking Seddigheh Babaee Seddigheh.babaee@uhasselt.be
Magnitude of the problem, increasing trends Number of deaths (millions) Nearly 1.3 million deaths 20-50 million injured 2 1.8 1.3 1.3 1 <1 AIDS-related deaths Tuberculosis Road traffic Malaria UNAIDS 2008 WHO 2008 WHO 2004 WHO 2008
Top 10 leading causes of death 2004 2030 Rank Disease or Injury Rank Disease or Injury 1 Ischaemic heart disease 1 Ischaemic heart disease 2 Cerebrovascular disease 2 Cerebrovascular disease 3 Lower respiratory infections 3 Chronic obstructive pulmonary disease 4 Chronic obstructive pulmonary disease 4 Lower respiratory infections 5 Diarrhoeal diseases 5 Road traffic injuries 6 HIV/AIDS 6 Trachea, bronchus, lung 7 Tuberculosis cancer 8 Trachea, bronchus, lung 7 Diabetes mellitus cancer 8 Hypertensive heart disease 9 Road traffic injuries 9 Stomach cancer 10 Prematurity & low-birth 10 HIV/AIDS weight
Literature review • Bella, F. , 2008. Driving simulator for speed research on two-lane rural roads • Boyle & Lee , 2010. Using driving simulators to assess driving safety • Montella et al. 2011. Simulator Evaluation of Drivers’ Speed, Deceleration and Lateral Position at Rural Intersections in Relation to Different Perceptual Cues • Auberlet et al. 2012. The Impact of Perceptual Treatments on Driver’s Behavior: From Driving Simulator Studies to Field Tests-first Results • Merat & Jamson 2013. The Effect of Three Low-cost Engineering Treatments on Driver Fatigue: A Driving Simulator Study
Objective We aim to investigate the driving behavior of different drivers in and nearby a curve using data from a fixed-based driving simulator in order to: Identify the best drivers within the sample To gain insight into the most problematic behavior of each driver
Methodology: data collection and analysis Real-world simulator image The road width is 2.8m and the posted speed limit is 70km/h
Methodology: participants and simulator Participants 38 volunteers 4 excluded: 2 simulator sickness, 2 miss values 34 participants in dataset; 23 men, 11 women Age: 18-54 mean age 26.32; SD 10.47 Driving simulator Fixed-base STISIM M400 with 180 ° parabollic screen 7
Indicators of driving behavior Speed The resultant of longitudinal and lateral speed is used Acceleration The resultant of longitudinal and lateral acceleration is used Lateral position
8 different measurement points P1: 500m P2: 166m Before curve P3: 50m P4: curve entry P5: middle curve At curve P6: curve end P7: 50m After curve P8: 100m
Hierarchically structured driving performance indicators
Multiple Layer Data Envelopment Analysis- MLDEA • The focus of DEA is on individual • By solving the model, the best possible indicator weights are determined • An index score between zero and one is obtained for each driver, with a higher value indicating a better performance • Take into account the layered hierarchy of indicators that often exist in reality
Results and discussion Index scores and drivers ranking Weight allocation and required improvement priorities Comparison of typical drivers in terms of driving performance parameters
Index scores and drivers ranking Multiple Layer DEA-CI Sensitivity Analysis Driver ID Score Driver ID Ave. Score 1 1.000 1 1.000 13 1.000 33 1.000 14 1.000 14 0.999 33 1.000 13 0.998 6 0.997 6 0.997 34 0.993 5 0.995 5 0.992 34 0.992 9 0.984 9 0.989 2 0.981 2 0.985 32 0.973 32 0.979 . . . . . . . . . . . . 3 0.894 3 0.903 8 0.885 8 0.896 23 0.883 16 0.888 16 0.877 23 0.886 12 0.877 12 0.884 7 0.852 7 0.862 18 0.822 18 0.832 28 0.804 28 0.823 29 0.793 29 0.810 21 0.740 21 0.752
Sensitivity Analysis: Boxplot of drivers when eliminating indicators at one point at a time
Required improvement priorities for the case of worst driver Acceleration
Our methodology matches the experimental data accurately The speed of the best-performer versus the worst-performer Speed (Km/h) Best performer Worst performer 140 130 120 110 100 90 80 70 60 50 40 P1 P2 P3 P4 P5 P6 P7 P8
The acceleration of the best-performer versus the worst-performer Best performer b) Lat Acc m/s 2 a) Long Acc m/s 2 Worst performer 2 0.5 1 0 1 2 3 4 5 6 7 8 -0.5 0 P1 P2 P3 P4 P5 P6 P7 P8 -1 -1 -1.5 -2 -2 -2.5 -3 -3 -3.5 -4 -4
Conclusion The application of this methodology to simulator data is innovative and will: Distinguish the best drivers Gain insight into the most problematic behavior of each driver Future research Assessment with respect to older drivers Focus on young novice drivers
Thank you for your attention seddigheh.babaee@uhasselt.be Babaee, S., Hermans, E., Shen, Y., Wets, G., Brijs, T.
Recommend
More recommend