I/O Performance Addicts erhtjhtyhy Shane Snyder Argonne National - PowerPoint PPT Presentation
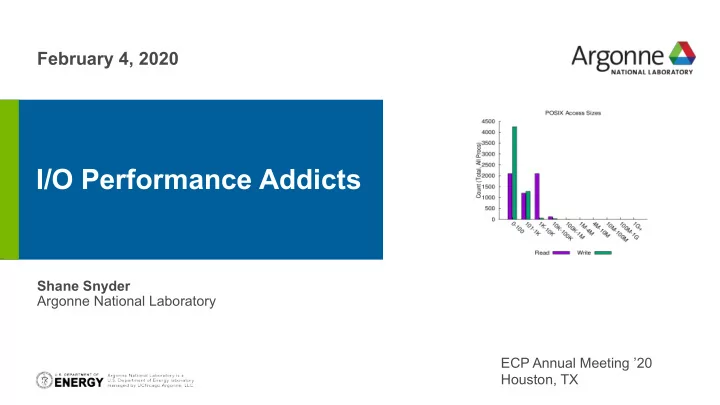
Suggested line of text (optional): WE START WITH YES. February 4, 2020 I/O Performance Addicts erhtjhtyhy Shane Snyder Argonne National Laboratory ECP Annual Meeting 20 Houston, TX Why are we here? Because I/O performance is addicting!
Suggested line of text (optional): WE START WITH YES. February 4, 2020 I/O Performance Addicts erhtjhtyhy Shane Snyder Argonne National Laboratory ECP Annual Meeting ’20 Houston, TX
Why are we here? Because I/O performance is addicting! ❖ Modern scientific computing applications access increasingly large and complex datasets to enable productive insights ❖ To support the diverse I/O needs of these Visualization of entropy in Terascale Supernova Initiative application. Image applications, HPC systems are embracing from Kwan-Liu Ma (UC Davis) deeper storage hierarchies and more elaborate layers of I/O libraries ❖ I/O analysis tools are of great help for navigating the complexity of HPC storage systems IBM Summit (OLCF) 2
Suggested closing statement (optional): WE START WITH YES. AND END WITH THANK YOU. DO YOU HAVE ANY BIG QUESTIONS? Darshan: An application I/O characterization tool for HPC
What is Darshan? ❖ Darshan is a lightweight I/O characterization tool that captures concise views of HPC application I/O behavior ➢ Produces a summary of I/O activity for each instrumented job ■ Counters, histograms, timers, & statistics ■ Full I/O traces (if requested) ❖ Widely available Deployed (and typically enabled by default!) at many HPC facilities relevant to ECP ➢ ❖ Easy to use ➢ No code changes required to integrate Darshan instrumentation Negligible performance impact; just “leave it on” ➢ ❖ Modular Adding instrumentation for new I/O interfaces or storage components is straightforward ➢ 4
How does Darshan work? ❖ Darshan inserts application I/O instrumentation at link-time (for static executables) or at runtime (for dynamic executables) Darshan instrumentation traditionally only compatible with MPI programs * ➢ ❖ As app executes, Darshan records file access statistics for each process ➢ Per-process memory usage is bounded to limit runtime overheads ❖ At app shutdown, collect, aggregate, compress, and write log data Lean on MPI to reduce shared file records to a single record and to collectively write log data ➢ ❖ With a log generated, Darshan offers command line analysis tools for inspecting log data darshan-job-summary - provides a summary PDF characterizing application I/O behavior ➢ darshan-parser - provides complete text-format dump of all counters in a log file ➢ * More on this later 5
Suggested closing statement (optional): WE START WITH YES. AND END WITH THANK YOU. DO YOU HAVE ANY BIG QUESTIONS? Using Darshan on ECP platforms
Using Darshan on Theta (ALCF) ❖ Theta is a Cray XC40 system that uses static linking by default* Static instrumentation enabled using Cray software module that injects linker options when ➢ compiling application Use ‘ module list ’ to confirm Darshan is actually loaded Darshan 3.1.5 current default version available on Theta If Darshan not loaded, you can load manually using ‘ module load ’ * More on this shortly 7
Using Darshan on Theta (ALCF) ❖ OK, Darshan is loaded...now what? Darshan logs stored in a central Just compile and run your application! ➢ directory -- check site Darshan inserts instrumentation directly into executable ➢ documentation for details . ❖ After the application terminates, look for your Logs further indexed using log files: ‘ year/month/day ’ the job executed. Pay attention to time zones to ensure you’re looking in the right spot. Log file name starts with the following pattern: ‘ username _ exename _ jobid …’ 8
Using Darshan on Cori (NERSC) ❖ Cori is also a Cray XC40 that has traditionally used static linking by default* Using Darshan on Cori is essentially identical to to the process used on Theta ➢ Use ‘ module list ’ to confirm Darshan is actually loaded Darshan 3.1.7 current default version available on Cori * More on this shortly 9
Using Darshan on Cori (NERSC) ❖ After compiling and running your application, look for your log files: 10
Using Darshan on Summit (OLCF) ❖ Summit is an IBM Power9-based system that uses dynamic linking by default LD_PRELOAD mechanism used to interpose Darshan instrumentation libraries at runtime ➢ Like Cori/Theta, software modules used to enable Darshan instrumentation ➢ Summit also provides ‘ module list ’ command Darshan 3.1.7 is the default version on Summit. Note: darshan-runtime and darshan-util are separate modules, with only darshan-runtime loaded by default 11
Using Darshan on Summit (OLCF) ❖ Since Summit uses LD_PRELOAD , there is no need to re-compile your application -- just run it and then look for your logs: 12
Note about dynamic linking on Cori/Theta ❖ In recent changes to the Cray programming environment, the default linking method was changed to dynamic ➢ Cori adopted at the beginning of the year Theta will be adopting soon ➢ ❖ We are working with ALCF and NERSC to accommodate these changes, focusing on a couple of options: Use an LD_PRELOAD mechanism similar to that used on Summit ➢ Use rpath mechanism to embed Darshan library path in dynamically-linked executable ➢ ❖ Goal is to rely on software modules on these systems to transparently enable/disable Darshan instrumentation regardless of the link method In the meantime, may be necessary to use LD_PRELOAD manually to interpose Darshan ➢ 13
Suggested closing statement (optional): WE START WITH YES. AND END WITH THANK YOU. DO YOU HAVE ANY BIG QUESTIONS? Analyzing Darshan logs
Analyzing Darshan logs ❖ After generating and locating your log, use Darshan analysis tools to inspect log file data: Copy the log file somewhere else for analysis Invoke darshan-parser (already in PATH on Theta) to get detailed counters Modules use a common format for printing counters, indicating the corresponding module, rank, filename, etc. -- here sample counters are shown for both POSIX and MPI-IO modules 15
Analyzing Darshan logs ❖ But, darshan-parser output isn’t so accessible for most users… use darshan-job-summary tool to produce summary PDF of app I/O behavior On Theta, texlive module is needed for generating PDF summaries -- may not be needed on other systems Invoke darshan-job-summary on log file to produce PDF A few simple statistics (total I/O time and volume) are output on command line Output PDF file name based on Darshan log file name 16
Analyzing Darshan logs Result is a multi-page PDF containing graphs, tables, and performance estimates characterizing the I/O workload of the application We will summarize some of the highlights in the following slides 17
Analyzing Darshan logs PDF header contains some high-level information on the job execution I/O performance estimates (and total I/O volumes) provided for MPI-IO/POSIX and STDIO interfaces 18
Analyzing Darshan logs Across main I/O interfaces, how much time was What were the relative totals of different I/O spent reading, writing, doing metadata, or operations across key interfaces? computing? Lots of metadata operations (open, stat, seek, If mostly compute, limited opportunities for I/O tuning etc.) could be a sign of poorly performing I/O 19
Analyzing Darshan logs Histograms of POSIX and MPI-IO access sizes are Table indicating total number of files of provided to better understand general access different types (opened, created, patterns read-only, etc.) recorded by Darshan In general, larger access sizes perform better with most storage systems 20
Analyzing Darshan logs reads Darshan can also provide basic timing bounds for read/write activity, both for independent file access patterns (illustrated) or for shared file access patterns writes 21
Suggested closing statement (optional): WE START WITH YES. AND END WITH THANK YOU. DO YOU HAVE ANY BIG QUESTIONS? What if we want more details?
Focusing analysis on individual files ❖ If we want to focus Darshan analysis tools on a specific file, Darshan offers a couple of different options ➢ darshan-convert utility can be used to create a new Darshan log file containing a specified file record ID (obtainable from darshan-parser output) ■ e.g., ‘darshan-convert --file RECORD_ID input_log.darshan output_log.darshan’ ■ New log file can be ran through existing log utilities we have already covered darshan-summary-per-file tool can be used to generate separate job summary PDFs for ➢ every file in a given Darshan log ■ Do not use if your application opens a lot of files! 23
Disabling reductions of shared records You may notice that Darshan is unable to provide more detailed access information for shared file workloads, as illustrated here This is as a result of Darshan’s decision to aggregate shared file records into a single file record representing all processes’ access information 24
Disabling reductions of shared records Setting the ‘ DARSHAN_DISABLE_SHARED_REDUCTION ’ environment variable will force Darshan to skip the shared file reduction step, retaining each process’s independent view of access information This results in larger log files, but may be useful in better understanding underlying access patterns in collective workloads 25
Recommend
More recommend
Explore More Topics
Stay informed with curated content and fresh updates.
