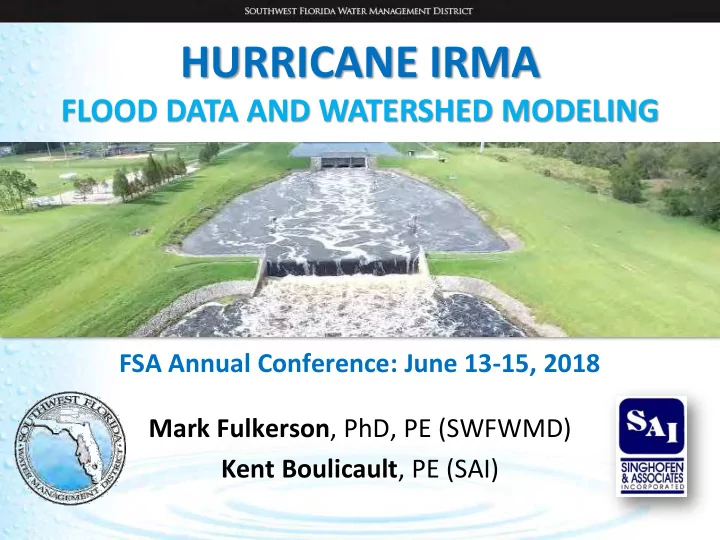

HURRICANE IRMA FLOOD DATA AND WATERSHED MODELING FSA Annual Conference: June 13-15, 2018 Mark Fulkerson , PhD, PE (SWFWMD) Kent Boulicault , PE (SAI)
O UTLINE • Hurricane Irma response • Management of flood data • Mill Creek watershed model Ifrc.org 2
H URRICANE I RMA • • Lifetime max winds 185 mph Landfall Cudjoe Key, FL: 130 mph (strongest in Atlantic outside Caribbean) (strongest continental Landfall) • Max winds for 37 hours • 1 st Cat 4 in FL since Charley (2004) • 3.25 days as a Cat 5 hurricane • 1 st Major Hurricane since Wilma (2005) (tied for longest in Atlantic) • • 8.5 days as a major hurricane 2 nd Landfall Marco Island, FL: 115 mph (2 nd since 1966 ) 3
S TORM P REPARATION 4-5 day potential track area • EOC activation • Tested/fueled generators • Deployed sandbags • Operated structures • Relaxed regulations 4
I RMA I MPACTS POWER OUTAGES FLOODING FISH KILLS STRUCTURE FAILURES FLOW RESTRICTIONS 5
S TORM R ESPONSE • Cleared debris • Repaired structures • Responded to flood complaints • Assisted other agencies/public • Documented high water 6
Approximate Path of Irma H IGH W ATER D OCUMENTATION • 400 flood photos • 270 flood complaints • 200 high water elevations 7
H IGH W ATER D ATABASE F LOOD C OMPLAINTS K NOWN F LOODING A REAS F LOOD P HOTOS H ISTORICAL W ATER L EVELS (location and elevation) ftp://ftp.swfwmd.state.fl.us/pub/gisdata/HighWater_Database/ 8
I MPORTANCE • Historical Evidence • Public Awareness 9
Surface Water Gage I MPORTANCE • Historical Evidence • Public Awareness • Limited Data 10
I MPORTANCE • Historical Evidence • Public Awareness • Limited Data • Decision Making Built Flooded Mitigated 2002 2004 2006 11
I MPORTANCE • Historical Evidence • Public Awareness • Limited Data • Decision Making 2003 FLOOD PHOTO • Verification Tool Modeled 100-yr Floodplain (SWFWMD, 2010) No Historical FEMA Floodplain 12
W ATERSHED M ANAGEMENT P ROGRAM • Cooperative funding • Identify flood risk • Storm water implementation projects (122) (35) 13
Mill Creek Watershed BUFFALO CANAL/ FROG CREEK GAMBLE CREEK MANATEE RIVER LAKE MANATEE SR-64 MILL CREEK BRADEN RIVER 14
Mill Creek Watershed MANATEE RIVER LAKEWOOD RANCH BLVD MILL CREEK SR-64 15
Model Network Development (1D / 2D) Legend Mill Creek Watershed Nodes ! ( Links Channels Drop Structures Pipes Rating Curves Weirs Subbasins 16 2D Areas
2D Feature Development 17
Field Data Acquisition SAI SWFWMD Collaborative Effort SAI & SWFWMD 18
Field Data Acquisition • SWFWMD – Stream cross-sections – Bridges – Structures distant from hard surfaces 19
Field Data Acquisition • SWFWMD – High water marks – Coordinated with residents 20
Flooding and High Water Documentation Inactive: 2013 Inactive: 2016 Installed: 2016 Hurricane Irma High Water Mark Legend ! . Gages # * Flooding Photo Locations * # Known Flooding Locations # * Historic Water Levels # * Flooding Complaint Locations Hurricane Irma: 6.3” in Mill Creek 21 Mill Creek Watershed
Comparison of Observed Stage and Preliminary Simulated Stage During the IRMA Storm at Gage (E. Mill Run) Observed: 20.0 FT-NAVD Simulated: 17.7 FT-NAVD 22
Comparison of High Water Mark and simulated stage of White Eagle Boulevard @ Mill Creek Observed: 19.8 FT-NAVD Simulated: 21.2 FT-NAVD 23
Comparison of High Water Mark and simulated stage of Rye Road @ 18th Place East Observed: 17.2 FT-NAVD Simulated: 21.2 FT-NAVD 24
Preliminary Flood Plain for Hurricane IRMA (State Rd. 64 @ Rye Rd.) 25
Calibration – Next Steps • Evaluate ICPR V4 Runoff methodologies (Curve Number, Green-Ampt, Vertical layers • Calibration / sensitivity analyses – Hydraulic • Initial conditions (wetland/lake stages, etc.) • Flow obstructions (sediment accumulation) • Manning’s values in 1D and 2D areas – Hydrologic - Runoff evaluation • Soil parameters (permeability / thatch effects, soil storage) • Antecedent conditions • Peak Rate Factor • Calibrate 1D ag areas using 2D approach (consider pumping operations) • Validate the calibrated model using August 2017 storm or TS Hermine 26
27
Q UESTIONS ? Hurricane Irma, 2017 MICHAEL SECHLER
Recommend
More recommend