
How Broadband and Internet can help reduce global warming Bill St. - PowerPoint PPT Presentation
How Broadband and Internet can help reduce global warming Bill St. Arnaud CANARIE Inc www.canarie.ca Bill.st.arnaud@canarie.ca Unless otherwise noted all material in this slide deck may be reproduced, modified or distributed without prior
How Broadband and Internet can help reduce global warming Bill St. Arnaud CANARIE Inc – www.canarie.ca Bill.st.arnaud@canarie.ca Unless otherwise noted all material in this slide deck may be reproduced, modified or distributed without prior permission of the author
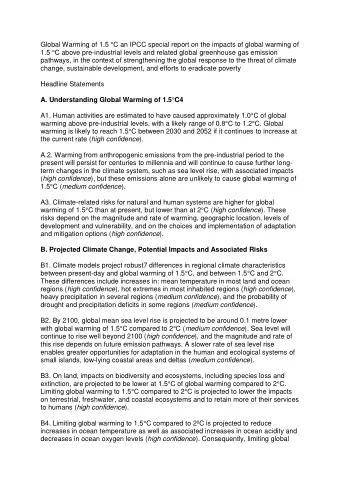
The Climate Change Imperative > One of , if not, the greatest threat to our future society and economy is global warming. > 15-30% cut in greenhouse gas emissions by 2020 will be needed to keep the temperature increase under 2 ° C, and a deeper reduction by 60-80% may be needed by 2050.* > Past IPCC assessments have underestimated the pace of change > Latest data indicates we are at the high end of projections > It will be necessary to go beyond incremental improvements in energy efficiency, current life-styles and business practices. Significantly more drastic measures will need to be undertaken *International Panel on Climate Change
Our Challenge 26 tons/person j 2 tons/person 1 ton/person j j 2008 2050 2100 Source: Stern 2008
ICT and CO2 emissions* > It is estimated that the ICT industry alone produces CO2 emissions that is equivalent to the carbon output of the entire aviation industry. > ICT emissions growth fastest of any sector in society, doubling about every 4 years > One small computer server generates as much carbon dioxide as a SUV with a fuel efficiency of 15 miles per gallon > Average utilization of servers is less than 6%. > Typical university produces 200,000 – 500,000 metric tons CO2 per year of which 100,000 – 300,000 tons is from Cyber- infrastructure and ICT *An Inefficient Truth: http://www.globalactionplan.org.uk/event_detail.aspx?eid=2696e0e0-28fe-4121-bd36-3670c02eda49
University GHG emissions � Projected GHGs are based on Planned Growth in Ten Year Capital Plan Source: SFU Facilities Services ��� ENERGY MANAGEMENT 1965 - 2008
CI major cause of GHG emissions TASC2 Research Building ���
UCSD Greenhouse Gas Emission Measuring Our Footprint
The Problem > Compute energy/rack : 2 kW (2000) to 30kW today > Cooling and power issues now a major factor in CI design > But academic CI is often too small: departmental closets and server huggers > Energy use of departmental facilities is growing exponentially creating crises of space, power, and cooling > Unfortunately, almost nothing is known about how to make these shared virtual clusters energy efficient, since there has been no financial motivation to do so *Source: Tom DeFanti GreenLight
Why ICT and Internet is critical to reducing CO2 > Direct emissions of Internet and ICT are important at 2-3% of world emissions but, in order of impact, the most significant contribution we can make is through leveraged, or indirect, emissions reductions. > According to SMART 2020 these represent as much as a 15% reduction opportunity in global emissions. > (And SMART 2020 is one of the most conservative reports on the topic. Others identify even higher potential for savings).
Virtualization and De-materialization Source: European Commission Joint Research Centre, “The Future Impact of ICTs on Environmental Sustainability”, August 2004
Universities and regional optical networks are key > Bits and optical bandwidth are virtually carbon free > Optical networks (as opposed to electronic routed networks) have much smaller carbon footprint > Significant reduced CO2 impacts are possible through use of cyber-infrastructure tools like virtualization, clouds, SOA, grids, Web 2.0, etc. > Research needed in new “zero carbon” computer and network architectures needed to connect remote computers, databases and instruments will be essential > New zero carbon applications and “gCommerce”
Energy consumption versus GHG emissions > Number one problem facing the planet is climate change – Lots of confusion between Green IT, energy consumption, energy efficiency, Clean ICT, sustainable IT, Corporate social responsibility > Turning off the lights or computers may not be the answer – Also misleads people into thinking problem is easy to solve > Our focus should be on how ICT can reduce GHG emissions – NOT energy consumption or energy efficiency – NOT Clean ICT such as computer waste etc – NOT sustainable IT – NOT Corporate Social Responsibility
The Falsehood of Energy Efficiency > Lots of confusion between energy efficiency and consumption versus CO2 emissions > Most current approaches to reduce carbon footprint are focused on increased energy efficiency of equipment and processes > This approach is doomed to failure because of Khazzoom- Brookes postulate (aka Jevons paradox) – Greater energy efficiency reduces overall cost and therefore promotes increased usage > We need a “zero carbon” strategy because increased usage due to decreased cost from efficiency will not change emission equation – Anything times zero is zero
The Carbon Economy > Global carbon market expected to grow 58% in 2008 to $92 billion > $57 trillion - Carbon Disclosure Project signatories, 1000s of companies participating, expanding to supply chain accounting > $500 billion - Value of low-carbon energy markets by 2050 > $100 billion - Demand for projects generating GHG emissions credits by 2030 > UK carbon abatement is estimated to be 900m Euro > Carbon economy has potential to pay for several bank bail- out’s and 3 or 4 Iraq like wars Source: ClimateCheck
What does a price of $100 per tonne of CO 2 imply? • $40 more on a barrel of crude oil • $1.00 more on US gallon of gas ( � 0.20 on a litre of petrol) • $.08/kwh more on electricity from coal •Effectively doubling price of electricity from coal • $0.03/kwh more on electricity from gas • $100 more on a return air ticket from New York to Chicago Sources: Dr Chris Hope, Cambridge
Primer on the Carbon Economy • In general, there are two types of emission trading schemes: • Cap and Trade • Baseline and Credit • Emission trading schemes can be: • Regulated (mandated by a government or regional authority) • Voluntary (entered into on an individual transaction basis, or though ongoing contractual arrangements) • To participate in carbon market you must join a registry • ACX – Australian Climate Exchange Source: ClimateCheck
How the carbon economy works Voluntary and Regulated Markets – Open System GHG emission reduction calculated as the difference between the actual emissions from an activity and the emissions of the projects baseline scenario Baseline GHG Emissions Year 1 Year 2 Actual GHG Emissions through use Year 3 of ICT, etc Time Source: ClimateCheck
Baseline and Credit • GHG projects create credits by either: • Reducing the amount of GHG emissions released to the atmosphere from one or more GHG sources, or • Increasing the amount of GHG removed from the atmosphere. • For ICT sector most emission reductions are indirect (Scope 2) through the reduction in consumption of electricity • Amount of credit available depends on type of fossil fuel used to generate electrical power (coal, gas, oil, etc) and whether it is base load or peak load • Credits are purchased by emitters in voluntary markets for reasons including corporate social responsibility, green branding, and carbon neutral product claims Source: ClimateCheck
“Zero Carbon” Data Centers can provide significant carbon credits > Purchasing green power locally is expensive with significant transmission line losses – Demand for green power within cities expected to grow dramatically – If data center produces 200,000 mT of CO2 @ $100 per ton =$20m > Data center facilities DON’T NEED TO BE LOCATED IN CITIES – -Cooling also a major problem in cities AISO Solar Powered Data Islandia GigaCenter Data Center, California Digital Data Archive Kelowna, BC Iceland
Your carbon inventory 14062 life cycle operation 5 years coal > Optical Switch 4 tons 20 tons > Router 16 tons 500 tons > Optical Amplifiers 2 tons 40 tons > Computer server 12 tons 40 tons > Ethernet switch 8 tons 20 tons > PC 20 tons 5 tons > Travel to install and repair - 100 tons > Virtualized network and computers can save 50% of your carbon emissions!
Do your carbon inventory NOW!! > You can not earn credits until you do an inventory and calculate baseline emissions > Next year carbon cap price will be $100 per ton in Europe > At European cap price the cost of GHG emission could be as much $10 - $50 million per year for university in the next decade This is money that must be paid into a carbon trust or exchange – A lot depends on details of Australia’s cap and trade – > Conversely university could earn $10 - $50 million per year if a university is zero carbon No revenue potential if university is carbon neutral –
American College & University President’s Climate Commitment “Signatories agree to… Create institutional structures Select & implement tangible actions to reduce greenhouse gases Complete a comprehensive greenhouse gas inventory Develop a climate-neutral action plan Make information publicly available”
Recommend


More recommend
Explore More Topics
Stay informed with curated content and fresh updates.