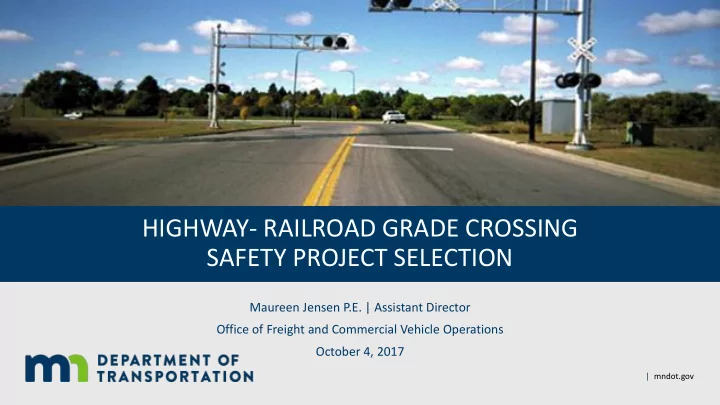

HIGHWAY- RAILROAD GRADE CROSSING SAFETY PROJECT SELECTION Maureen Jensen P.E. | Assistant Director Office of Freight and Commercial Vehicle Operations October 4, 2017 | mndot.gov
Outline • Grade Crossing Safety Background • Development of Risk Factor Method • Future Project Selection Process • Discussion 10/4/2017 2
Minnesota Railroad Safety Facts • In the state of Minnesota there are approximately 4,000 at-grade public crossings • Of the 4,000 public crossings over a third have active warning devices (Gates, Flashers). • Over 85% of trips (AADT) and 60% of trains cross at active crossings
Grade Crossing Safety Program Goals • Eliminate fatalities and injuries at grade Funding: crossings (TZD) Section 130: $6.5M State: $1 M • Maintain warning devices in a state of good repair 10/4/2017 4
Minnesota Grade Crossing fatalities 2004-2013 Stop Crossbucks Sign Flashers Gates Total Did not stop 14 24 2 40 Stopped on crossing 1 2 1 3 7 Stopped then proceeded 2 2 Suicide 1 1 Went around gates 9 9 Went thru gate 1 1 Unknown 1 1 7 9 Grand Total 18 28 3 20 69 Percent of fatalities 26 41 4 29 % AADT 11 7 24 58 5
MAP-21 – PUW Process Update • Candidate crossings were selected by each ATP, based on input from OFCVO, Local Road Authorities and railroads. • OFCVO used the federal accident prediction (AP) model for screening - train and vehicle exposure, crash history. • Didn’t always result in the highest risk crossings (Federal Guideline) • Local Road Authorities were unable to provide match funds in some cases • ATP targets difficult to establish • Could take 6 years to get a project programmed • Most states taking a statewide approach STATEWIDE PROGRAM, NO MATCH 6
Development of Risk Factors for Screening (2015) • Accident Prediction Equation wasn’t aligning with the risks seen by MnDOT or road authorities • Minnesota’s 10-year crash history analysis • 91% of public grade crossings had NO crashes. • 96% had NO crashes resulting in injuries. • 99% had NO fatal crashes. • 1 crossing had TWO fatal crashes. • More than 50% of crossings with a injury crash had NO prior crashes. • Presence of a single crash at a crossing suggests that a second crash (in the next 10 years) is unlikely. 7
RISK FACTOR DETERMINATION 38% of Fatal Crashes vs. 42% of Fatal Crashes vs. 24% of Crossings 23% of Crossings 8
SELECTED RISK FACTORS Active Passive Risk Factors Minimum Maximum Minimum Maximum Volumes Roadway AADT 2500 Unlimited 150 Unlimited Total Trains per Day 10 Unlimited 4 Unlimited Volume Cross Product 20,000 Unlimited 750 Unlimited Speeds Roadway Speed Limit 45 Unlimited Maximum Timetable Speed 31 Unlimited 36 Unlimited Design Number of Mainline Tracks 2 Unlimited Skew ≥15 ° ≥15 ° Surroundings Distance to Nearby Intersection 1 foot 99 feet 40 feet 160 feet Distance to Nearest Crossing 0.5 mile 1 mile 0.5 mile 1 mile Clearing Sight Distance Any Quadrant Fails Any Quadrant Fails Approaching Sight Distance Any Quadrant Fails 9
Safety Improvement Strategies Warning Devices • New signals and gates • Signs and Pavement Markings • Replacement of antiquated/upgrades • Ped gates, mazes • Medians Elimination of Hazards • Improve geometrics • Eliminate at-grade crossings (Consolidation, closure) • Improve sight lines • Grade separation (roadway, pedestrian) 10
District 8 ATP Projects FY Location CSAH 6, 190 th St NE, Township of Roseville, Kandiyohi County- install gates 2017 2017 M1, Dike Rd, Granite Falls, Yellow Medicine County - install gates 2017 CSAH 7, Stewart, McLeod County - upgrade system 2018 CSAH 4, 150th St SE, Atwater, Kandiyohi County - upgrade system 2018 CSAH 9, Darwin, Meeker County - upgrade system T 170, 45 th Ave SW, Township of Willmar, Kandiyohi County 2019 2019 US 12, Willmar, Kandiyohi County - upgrade system The most successful safety strategies are not realistic for every at-risk crossing. • Signals + Gates + Medians has the best safety performance but the highest implementation costs ($500k- $700k). Must be replaced every 20-30 years. This results in a 300 year backlog. • Need lower cost (and effective) alternative strategies. • Corridor approach (such as the Crude by Rail Corridor) and County Safety Plans are an opportunity to partner with local agencies to accomplish closures + upgrades 11
2017 – New Project Selection Requirements • FHWA – 100% waiver for 130 ended – must be 90-10 • Legislature: MnDOT needs to improve transparency on how projects are selected. • Transparent – Clear to the public • Involvement of stakeholders • Scoring “formula” • Risk Factors are used to identify candidate pool, but are not the only factors for selecting safety projects and determining the best solution 10/4/2017 Optional Tagline Goes Here | mndot.gov/ 12
Develop Project Selection Process • Develop a Programming Update Workgroup Sub-committee to develop recommendations • Include members from ATP, MPO, LRA, FHWA, MnDOT, State Aid • Committee to review and recommend: • Program Goals • Statewide, APT approach • Eligibility/Focus Areas/Investment Goals • Selection/Scoring Criteria • Process and Documentation (Solicitation, etc) • Complete by May of 2018 for PUW, TPIC approval • Begin Using for 2021 10/4/2017 Optional Tagline Goes Here | mndot.gov/ 13
Discussion and Questions 14
Thank you! Maureen Jensen Maureen.jensen@state.mn.us 651-366-3668 10/4/2017 Office of Freight and Commercial Vehicle Operations | mndot.gov 15
Recommend
More recommend