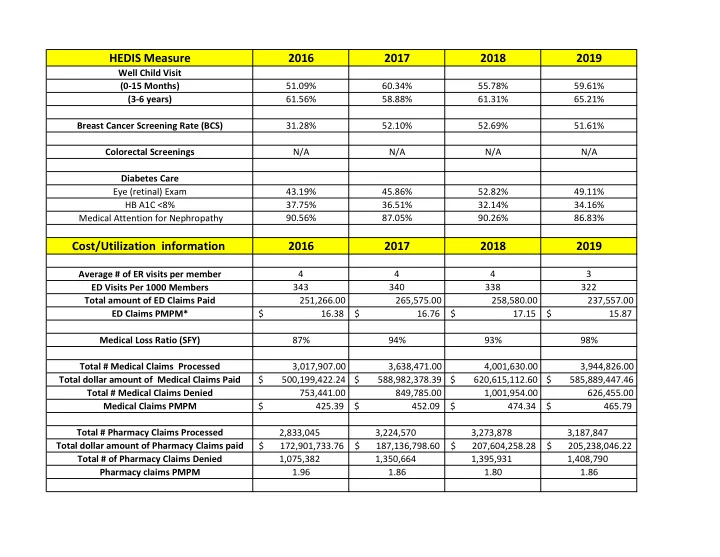

HEDIS Measure 2016 2017 2018 2019 Well Child Visit (0-15 Months) 51.09% 60.34% 55.78% 59.61% (3-6 years) 61.56% 58.88% 61.31% 65.21% Breast Cancer Screening Rate (BCS) 31.28% 52.10% 52.69% 51.61% Colorectal Screenings N/A N/A N/A N/A Diabetes Care Eye (retinal) Exam 43.19% 45.86% 52.82% 49.11% HB A1C <8% 37.75% 36.51% 32.14% 34.16% 90.56% 87.05% 90.26% 86.83% Medical Attention for Nephropathy Cost/Utilization information 2016 2017 2018 2019 Average # of ER visits per member 4 4 4 3 ED Visits Per 1000 Members 343 340 338 322 Total amount of ED Claims Paid 251,266.00 265,575.00 258,580.00 237,557.00 ED Claims PMPM* $ 16.38 $ 16.76 $ 17.15 $ 15.87 Medical Loss Ratio (SFY) 87% 94% 93% 98% Total # Medical Claims Processed 3,017,907.00 3,638,471.00 4,001,630.00 3,944,826.00 Total dollar amount of Medical Claims Paid $ 500,199,422.24 $ 588,982,378.39 $ 620,615,112.60 $ 585,889,447.46 Total # Medical Claims Denied 753,441.00 849,785.00 1,001,954.00 626,455.00 Medical Claims PMPM $ 425.39 $ 452.09 $ 474.34 $ 465.79 Total # Pharmacy Claims Processed 2,833,045 3,224,570 3,273,878 3,187,847 Total dollar amount of Pharmacy Claims paid $ 172,901,733.76 $ 187,136,798.60 $ 207,604,258.28 $ 205,238,046.22 Total # of Pharmacy Claims Denied 1,075,382 1,350,664 1,395,931 1,408,790 Pharmacy claims PMPM 1.96 1.86 1.80 1.86
Patient Satisfaction Surveys CAHPS Adult Version Rating of All Health Care (Q13) 2016 (% Always or Usually) ; 2017-19 (% 9 or10) 78.90% 78.81% 77.43% 84.40% Rating of the Health Plan (Q35) 2016 (% 8, 9, or 10); 2017-2019 (% 9, or10) 80.60% 80.67% 85.09% 82.66% Rating of Person Doctor (Q23) 2016 (% Always or Usually); 2017- 19 (% 9 or10) 81.80% 83.40% 85.20% 87.10% Rating of Specialist seen most often (Q27) 2016 (% Always or Usually); 2017-19 (% 9 or10) 81.20% 82.17% 83.58% 87.59% Customer Service 2016 (% 8, 9, or 10); 2017-19 (% Always or Usually) 86.60% 92.02% 91.18% 90.60% Getting Care Quickly 2016 (% 8, 9, or 10); 2017-19 (% Always or Usually) 84.30% 85.57% 84.38% 85.19% Getting Needed Care 2016-2019 (% Always or Usually) 84.50% 86.36% 88.21% 84.82% How Well Doctors Communicate 2016 (% 8, 9, or 10%); 2017-19 (% Always or Usually) 91.60% 92.12% 92.60% 95.66%
Shared Decision Making 2016 N/A; 2017-19 (% Yes) N/A 79.42% 78.40% 78.86% CAHPS Child Version Rating of All Health Care (Q13) 2016 (% Always or Usually); 2017-2019 (% 9 or 10) 85.70% 86.22% 90.37% 86.92% Rating of the Health Plan (Q36) 2016 (% 8, 9, or 10); 2017-2019 (% 9 or 10) 79.50% 83.80% 88.08% 84.00% Rating of Personal Doctor (Q23) 2016 (% Always or Usually); 2017- 2019 (% 9 or 10) 83.00% 89.29% 90.70% 89.64% Rating of Specialist seen most often (Q27) 2016 (% Always or Usually); 2017-2019 (% 9 or 10) 86.40% 75.51% 76.47% 70.42% Customer Service 2016 (% 8, 9, or 10); 2017-2019 (% Always or Usually) 89.40% 94.82% 88.44% 92.00% Getting Care Quickly 2016 (% 8, 9, or 10); 2016-2019 (% Always or Usually) 92.00% 92.59% 94.00% 88.80% Getting Needed Care 2016- 2019 (% Always or Usually) 86.20% 88.81% 84.92% 84.20%
How Well Doctors Communicate 2016 (% 8, 9, or 10); 2017-2019 (% Always or Usually) 92.30% 94.48% 95.70% 93.95% Shared Decision Making 2016 (N/A); 2017-2019 (% Yes) N/A 81.75% 80.91% 81.62% *Per member per month
Note: 2019 excludes IBNR, based on calendar year Note: Based on state fiscal year Note: 2019 excludes IBNR, based on calendar year
Recommend
More recommend