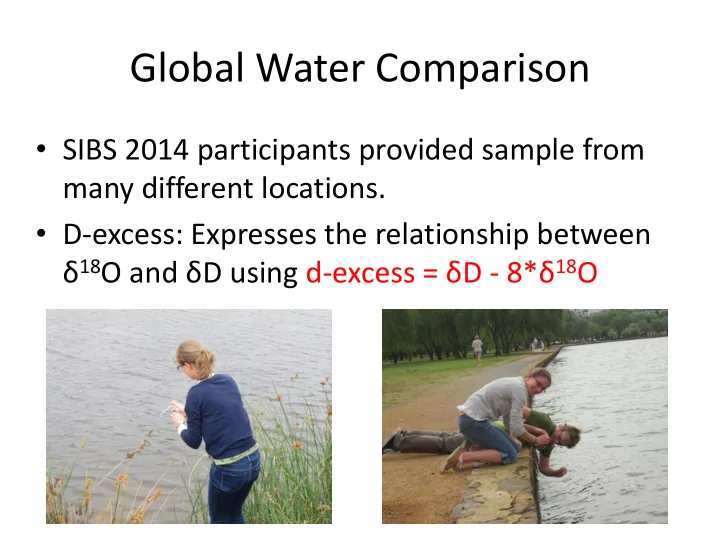

Global Water Comparison • SIBS 2014 participants provided sample from many different locations. • D-excess: Expresses the relationship between δ 18 O and δ D using d-excess = δ D - 8* δ 18 O
Corrected δ 18 O Corrected D Sample ID H 2 O D Excess Gugong 20476 -5.03 -35.69 4.5 Hepburn 20640.5 -6.11 -36.04 12.8 Corin Dam 19895 -6.88 -43.89 11.1 Eden 19928 -5.83 -36.94 9.7 Ljuvljana 20827.5 -9.28 -61.47 12.7 Beijing 19759.5 -7.79 -60.25 2.1 Farciones Vega 19248.5 -10.19 -77.54 4.0 Tidbinbilla 20752 -5.45 -37.28 6.4 Evian 20803.5 -9.73 -75.07 2.8 Cool Ridge 19788.5 -6.44 -36.85 14.7 Beloka 19622 -8.05 -52.19 12.2 Reid Rain 31 Nov 21107.5 -0.42 -3.79 -0.5 Reid Rain 25 Nov 20951.5 -10.11 -71.41 9.4 Casuarina Sands 19639 -3.63 -29.13 -0.1 Katoomba 19316 -3.75 -21.46 8.5 East Coast Kalnura 21210 -5.49 -31.05 12.9 Cotter River 20939.5 -4.92 -32.33 7.0 Lake District, Kendall 21045.5 -7.09 -47.16 9.6 Huskison 18130.5 -4.53 -17.11 19.2 Sydney 18192 -5.33 -27.53 15.1 Tuscany 20391 -6.71 -40.36 13.3 Brisbane 20775.5 -2.96 -22.00 1.7 Narellan Vale 18547.5 -5.15 -24.64 16.6 Cairns 20089 -4.62 -22.31 14.6 Edinburgh 20975.5 -7.96 -53.97 9.7
Corrected deuterium values. Cairns Narellanvale Brisbane Monteviva tuscany Sydney Huskison Lake District, Kendall Edinburgh Cotter River East Coast Kalnura Katoomba Casuarina Sands Reid Rain (25 Nov) Reid Rain (31 Nov) Beloka Cool Ridge Evian Tidbinbilla Farciones Vega Beijing Ljuvljana Eden Corin Dam Hepburn Gugong -5 0 5 10 15 20 25
1 Gugong 2 Hepburn 3 Corin Dam 4 Eden 5 Ljuvljana 6 Beijing 7 Farciones Vega 8 Tidbinbilla 9 Evian 10 Cool Ridge 11 Beloka 12 Reid Rain (31 Nov) 13 Reid Rain (25 Nov) 14 Casuarina Sands 15 Katoomba 16 East Coast Kalnura 17 Cotter River 18 Edinburgh 19 Lake District, Kendall 20 Huskison 21 Sydney 22 Monteviva tuscany 23 Brisbane 24 Narellanvale 25 Cairns
Extracting Leaf and Xylem Water
Extraction Method
Rooting depth effects using DBH
Mistletoe in Eucalyptus Trees
Comparisons among Species
Methods comparison Freezer Block versus Vacuum Line
Objective: To estimate effective path length in species with different venation Isotopic composition of the bulk leaf lamina reflects variation in: 1. Source water isotope signature (i.e. xylem water) 2. The evaporative enrichment during transpiration Evaporative enrichment is a function of transpiration rate, modulated by the scaled effective path length → Peclet number Peclet effect accounts for the fact that diffusion of water from the sites of evaporation to the rest of the leaf is counteracted by the input of unenriched water through the transpiraitonal flow. EL 1 e e L CD
Hydraulic conductivity of the leaf increases as the effective path length decreases Ferrio et al. 2012
K leaf linked to vein density via the shortening of the pathway of water movement from vein ending to evaporative sites ( D m ). 800 700 600 500 D m 400 300 200 100 0 0 5 10 15 20 Vein density (mm mm -2 )
Hypothesis 1: “effective path length” may reflect vein density on the basis that for a given VPD, vein density may constrain E. We predict that under optimal conditions, a species with a low vein density will have a low E rate and therefore greater leaf water enrichment, which when you solve for L would predict a larger effective path length to a plant where E rate was high. PLANTS ALL WATER STRESSED!
Hypothesis 2: Under water stress conditions causing reduced E, the fraction of the two pools of water: 1) the enriched mesophyll and 2) the unenriched xylem, water would become important factors in the prediction of bulk leaf water enrichment. We predict that plants with high vein density would have a larger unenriched pool contributing to the leaf water 18 0 signal, compared with a species with low vein density.
3 species: Ginkgo biloba D v = 1.4 Alnus glutinosa D v = 7 Populus nigra D v = 23.3
Peclet model of leaf water enrichment to solve for L L = average lamina leaf water enrichment 1 e = the Péclet number e E = transpiration rate L L = scaled effective path length C = molar concentration of water 18 O in water D = diffusivity of H 2 w e e e a e k v k w i e = evaporative site water enrichment EL e + = equilibrium fractionation e k = kinetic fractionation v = enrichment of vapor outside the leaf CD w a = water vapor mole fraction outside leaf w i = water vapor mole fraction inside leaf
Peclet model of leaf water enrichment predicts less enriched leaf water as observed: 40.00 35.00 30.00 Increasing enrichment of 18 O 25.00 Istopic enrichment without Δ L 20.00 Peclet effect Isotopic enrichment with Peclet (observed value) 15.00 10.00 5.00 0.00 Ginkgo Populus Alnus
- Under low E, positive relationship between Dv and L (opposite of prediction under maximum rates of E for a given VPD) - Need to account for the contribution of the xylem fraction to leaf water enrichment 0.25 Scaled effective path length 0.2 0.15 y = 0.0097x + 0.0026 0.1 R² = 0.9975 0.05 0 0 5 10 15 20 25 Vein density (mm mm -2 )
Recommend
More recommend