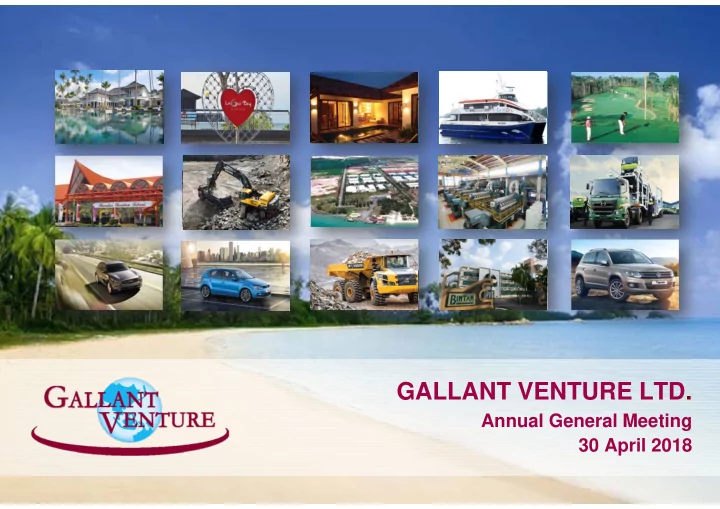
GALLANT VENTURE LTD. Annual General Meeting 30 April 2018
Contents • Financial Highlights • Segments Performance • Business Highlights • Looking forward • Q&A 2
Financial Highlights Independent Auditor’s Report The Company’s independent auditor, Foo Kon Tan LLP has issued a “ except for ” qualified opinion on the audited financial statements of the Company and its subsidiaries for financial year ended 31 December 2017. The “ except for ” qualified opinion was related to the opening balances and prior year disclosures as a result of the disclaimer opinion issued by the auditor in the previous year in relation to consolidation of Market Strength Limited (“MSL”) and the accuracy of the gain on the disposal of MSL This matter has been considered resolved in 2017 and will not brought forward to 2018. 3
Financial Highlights Financial Performance (S$ million) FY2016 FY2017 Changes Comment Revenue 1,715.8 1,746.7 1.8% Higher revenue from truck and heavy duty equipment, financial services , car rental and after sale servicing Gross Profit 307.8 343.3 11.5% Higher margin from financial services, car rental and after sale servicing (148.4) (1) Net Profit/(loss) (136.4) 8.1% Lower operating expenses but offset by attributable to higher losses from associated shareholder companies Net Profit/(loss) 72.2 (136.4) N.M One-time gain of S$220.6 mil from attributable to divestment of MSL in the previous shareholder period 79.9 (1) EBITDA (excl 94.7 18.5% one-time gain) EBITDA 300.5 94.7 -68.5% (1) Exclude the one time gain of S$220.6 mil from divestment of MSL 4
Financial Highlights Normalized Performance FY 2017 (in S$ mil) FY 2016 (in S$ mil) Net profit before NCI -157.5 41.8 Net loss before NCI +13.7 Share of associate results Share of associate results +56.3 +16.7 Purchase Price Allocation +17.4 Purchase Price Allocation Foreign exchange -4.2 Foreign exchange +15.4 Non-recurring (1) -171.1 Non-recurring (1) +3.7 Deferred tax -0.3 +6.5 Deferred tax Normalized net loss before NCI -103.4 -58.2 Normalized net loss before NCI (1) exclude one-time gain from divestment of MSL, write off of (1) exclude one-time provision assets and associates and one-time provision 5
Financial Highlights (cont’d) Balance Sheet and Ratios (S$ million) 31 Dec 2016 31 Dec 2017 Non-current assets 2,466.6 2,401.9 Current assets 2,293.6 2,107.8 Total assets 4,760.2 4,509.7 Non-current liabilities 1,435.0 1,132.5 Current liabilities 1,458.4 1,665.1 Total liabilities 2,893.4 2,797.6 Cash & Cash Equivalents 425.4 258.4 Total Debt 2,437.5 2,276.5 Total Equity 1,866.8 1,712.1 Total Debt/ Total Equity 1.31x 1.33x Total Net Debt/ Total Equity 1.08x 1.18x Net Asset value per share (S$ cents) 32.11 27.05 6
Segment Performance Automotive Automotive (S$ million) FY2016 FY2017 Change Comments Revenue 1,555.3 1,587.9 2.1% Higher revenue from truck and heavy duty equipment, financial services , car rental related income and vehicle servicing Gross Profit 275.6 317.1 15.1% High margin from the increased revenue of financial services, car rental related income and vehicle servicing Share of (13.9) (56.5) -306.5% Higher losses from the associate companies in associates’ the automotive segment results EBITDA 48.0 72.9 51.9% Higher gross profit margin was partially offset by higher loss from associate’s companies NPAT (97.0) (79.9) 17.6% Higher finance and tax expenses Total assets 1,660.2 1,793.2 8.0% 7
Segment Performance (cont’d) Utilities Utilities (S$ million) FY2016 FY2017 Change Comments Revenue 100.2 101.7 1.5% Higher revenue from power consumption in Batamindo Industrial Park and Bintan Resorts Gross Profit 30.6 30.4 -0.7% Higher fuel cost EBITDA 45.1 36.5 -19.1% Higher operating expenses and foreign exchange loss as compared to foreign exchange gain in the previous year NPAT 9.3 7.0 -24.7% Higher financing expenses Total assets 173.8 172.9 -0.5% 8
Segment Performance (cont’d) Utilities (cont’d) ELECTRICITY WATER 600 5,000 4,333 487 4,500 468 500 3,586 4,000 31 759 Generation - Kwh (in mil) 33 42 43 44 791 38 Proceed - m3 (in '000) 36 34 3,500 30 836 32 400 360 828 291 842 3,000 231 240 185 300 2,500 2,000 418 408 200 398 395 390 3,214 1,500 3,026 2,819 2,628 2,559 1,000 100 500 - - 2013 2014 2015 2016 2017 2013 2014 2015 2016 2017 BIP BIIE Resort BIP BIIE Resort 9
Segment Performance (cont’d) Industrial Parks Industrial Parks (S$ million) FY2016 FY2017 Change Comments Revenue 40.0 32.7 -18.3% Lower revenue from housing projects and absence of factory sales as compared to S$4.1 mil in the previous year Gross Profit (0.2) (5.7) N.M 2016 includes S$3.2 mil gain on sales of factory EBITDA 17.2 15.2 -11.6% Higher operating expenses NPAT (12.5) (17.7) -41.6% Higher operating expenses Total assets 149.7 109.4 -26.9% 10
Segment Performance (cont’d) Industrial Parks (cont’d) FACTORY FACTORY OCCUPANCY RATE AVERAGE RENTAL RATE 100% 4.50 87% 90% 85% 85% 84% 83% 80% 4.00 4.16 4.09 67% 67% 66% 66% 66% 70% 3.86 3.83 3.83 60% 3.70 3.50 S$/sqm 3.47 50% 3.46 3.41 40% 3.00 3.14 30% 20% 2.50 10% 2.00 0% 2013 2014 2015 2016 2017 2013 2014 2015 2016 2017 BIP BIIE BIP BIIE 11
Segment Performance (cont’d) Resort Operations Resort Operations (S$ million) FY2016 FY2017 Change Comments Revenue 20.3 24.5 20.7% Higher revenue from ferry services and contribution from Holiday Villa Pantai Indah Gross Profit 2.3 4.1 78.3% Higher revenue but offset by higher diesel costs for ferries EBITDA 0.2 0.7 250% In line with higher tourist arrivals NPAT (6.8) (7.2) -5.9% Higher financing and tax expenses Total assets 37.8 38.1 0.8% 12
Segment Performance (cont’d) Resort Operations (cont’d) BINTAN RESORTS Tourist Arrival: 898,204 pax Total Room Key: +33% from 2016 1,890 room Events: • JGTA Bintan Lagoon Junior Championship • Tour de Bintan • Reebok Spartan Race • Bintan Color KasmaRun Activities: • Lagoi Bay Lantern Park • Safari Lagoi • “Odong-dong”, Segway • Kayaks, snorkeling • Bazaar • Outdoor food fair 13
Segment Performance (cont’d) Resort Operations (cont’d) BINTAN RESORTS TOURIST ARRIVAL BY MARKET DOMESTIC vs INTERNATIONAL TOURISTS Others 1,000,000 Korea 676,034 898,204 +33% 900,000 Philippines 480,544 800,000 Australia 700,000 360,321 600,000 UK 500,000 Malaysia 400,000 417,660 Japan 300,000 315,713 India 200,000 100,000 China - Singapore 2016 2017 Indonesia Domestic International - 50 100 150 200 250 300 350 400 450 2017 2016 Thousands Indonesia Singapore China India Japan Malaysia UK Australia Philippines Korea Others Total 2017 417,660 179,509 122,363 26,533 19,220 15,936 15,462 14,767 12,537 12,081 62,136 898,204 315,713 136,751 64,853 22,214 16,626 13,510 13,519 12,409 11,743 13,105 55,591 676,034 2016 %(+/-) 32% 31% 89% 19% 16% 18% 14% 19% 7% -8% 12% 33% 14
Segment Performance (cont’d) Property Development Property Development (S$ million) FY2016 FY2017 Change Comments Revenue - - - No land sale recognised during the year Gross Profit (0.5) (2.7) -440% Higher depreciation EBITDA (9.3) (8.9) 4.3% Foreign exchange gain as compared to foreign exchange loss in the previous year but offset by higher operating expenses NPAT (9.6) (11.9) -24.0% Higher depreciation and operating expenses Total assets 675.3 674.7 -0.1% 15
Segment Performance (cont’d) Property Development (cont’d) Alila Villas Bintan: 67 keys Holiday Inn : 300 Keys The Sanchaya: 26 keys Four Points by Sheraton : 300 Keys Holiday Villa Pantai Indah: 99 keys Novotel : 160 Keys Ibis : 160 keys The Haven : 1 st phase 500 Keys 2 nd phase 700 Keys Lagoi Bay Villas: 21 keys Grand Lagoi: 196 keys New Development : 2,000 Keys Dialoog by Malka : 200 Keys Upcom ing Developm ent Existing Developm ent 16
Bintan International Airport and Aerospace Park Phase 1 • Development of one runway and one terminal, which will be integrated to a regional ferry terminal servicing surrounding islands, including Singapore and Batam. • Develop MRO Centre as part of the 177-ha Bintan Aerospace Park to be located near to our existing Bintan Inti Industrial Estate. • Develop dedicated township to cater to the working community in the Bintan Aerospace Park. Phase 2 • Develop multi-terminal airport with two runways • Develop other aviation related supporting businesses. 17 17
Looking forward • Continue to deleverage and actively manage debts portfolio; • Drive productivities and operational efficiency across business segments so to contain and reduce costs; • Drive tourism and investments into Bintan; • Expand on direct tourist in-bound into Bintan from regional countries; • Continue to drive BOMC and food industrial cluster in Bintan; • Accelerate the development of Bintan International Airport and MRO segment; • Diversification of fuel sources so to improve utilities’ margin; and • To innovate and develop new related automotive businesses. 18
Thank You
Recommend
More recommend
Unleash a World of Digital Possibilities—Browse, Share, and Explore Content Without Boundaries