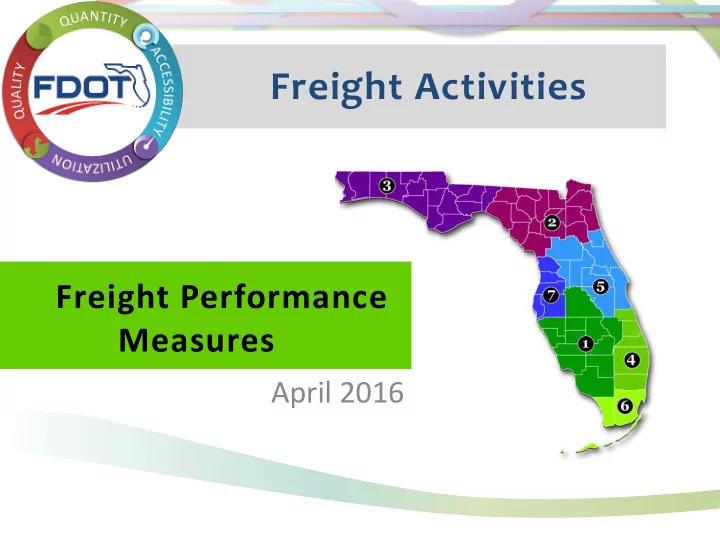

Freight Activities Freight Performance Measures April 2016
Mobility Performance Measures Reporting http://www.dot.state.fl.us/planning/statistics/sourcebook/ 2
Applicability to All Modes 3
MODE QUANTITY QUALITY ACCESSIBILITY UTILIZATION % Travel Meeting LOS Criteria Auto/Truck % Miles Meeting LOS Criteria % Miles Severely Congested Travel Time Reliability Vehicle Miles Traveled % Travel Severely Congested Travel Time Variability Time Spent Commuting Person Miles Traveled Hours Severely Congested Vehicle Hours of Delay Vehicles Per Lane Mile Person Hours of Delay PEOPLE Average Travel Speed Passenger Miles Traveled Transit Average Headway Passenger Trips Pedestrian Level of Service (LOS) % Sidewalk Coverage % Bike Lane/Shoulder Bicycle Level of Service (LOS) Coverage Aviation Passengers Departure Reliability Highway Adequacy (LOS) Demand to Capacity Ratios Rail Passengers Departure Reliability Highway Adequacy (LOS) Seaports Passengers Highway Adequacy (LOS) Combination Truck Miles Truck Travel Time Reliability Traveled % Miles Severely Travel Time Variability Truck Miles Traveled Congested Combination Truck Hours of Combination Truck Tonnage Vehicles Per Lane Mile Delay Combination Truck Ton Miles Combination Truck Backhaul Combination Truck Average FREIGHT Traveled Tonnage Travel Speed Value of Freight Tonnage Aviation Highway Adequacy (LOS) Value of Freight Rail Tonnage Highway Adequacy (LOS) Value of Freight Active Rail Access Tonnage Seaports Highway Adequacy (LOS) Twenty-Foot Equivalent Units Active Rail Access 4 Value of Freight
Freight Performance Measures 2015 Source Book - Addition of 4 freight measures 5
Reported for the Last 10 years Reliability Concept - Likelihood a shipper will arrive at a Variability Concept – How much travel time varies for a shipper. desired destination in a reasonable amount of time. (on- How much additional time does a traveler need to allow to not time arrival) be late to a destination. 6
FREIGHT PERFORMANCE MEASURES TASK WORK ORDER 7
Freight Performance Measures Vary by Stakeholder Federal States/ Government MPOs/RPCs Chokepoints Carriers System at international Shippers congestion, Business gateways and mobility, Service cost, profitability, along trade safety, security, speed, sustainability, corridors related efficiency, reliability, return on to equipment, economy, security, investment infrastructure, environment visibility operations, information, regulation 8
Recommended Performance Measures Performance Measure Category Truck Reliability Index Efficiency Average Travel Speed Efficiency Average Delay per Vehicle Efficiency Pavement Conditions Pavement Bridge Conditions Bridges Truck Injury Fatal Crashes Safety Highway-Rail At-Grade Crashes Safety Unfunded Freight Needs Versus Investment Economic Cost of Delay – Driver Economic Cost of Delay – Fuel Economic 9
Recommended Performance Measures Performance Measure Category Truck Tonnage Demand Truck Backhaul Tonnage Demand Truck Forecast Demand Truck Vehicle Miles Traveled Demand Truck Ton-Miles Demand Average Annual Daily Truck Traffic Demand Vehicles/Lane Mile Demand Percent of Miles Severely Congested Demand Annual Hours of Truck Delay Efficiency 10
Freight Intensity Measure 1) Annual average truck volume 2) Type of truck High value of time shipments shipment Low value of time shipments VOT 3) Percentage of trucks 11
Corridor Intensity Definitions High Intensity Corridors: 2500< AADTT < 4500 & 4500< AADTT < 6500 & 4500< AADTT < AADTT >= 6500 %High_VOT > 25% & %High_VOT > 25% 6500 & >15% Trucks >15% Trucks Medium Intensity Corridors: 2500< AADTT < 4500 & 4500< AADTT < 6500 & Truck AADT < 2500 & > %15 %High_VOT > 25% Trucks %High_VOT < 25% Low Intensity Corridors: 2500< Truck AADT < 4500 and Truck AADT < 2500 & > %15 Trucks %High_VOT < 25% 12
Freight Intensity Measure District 4 13
Freight Fluidity Project Supply Chain Measures The freight fluidity performance measures go beyond links and nodes to reflect the entire supply chain. Provide FDOT with Use a “market Describe the recommendations basket” approach condition and on what supply appropriate for performance of chain measures to public sector freight trips use decision-making 14
Freight Fluidity Analyses • Publix • Deseret Ranch • Armellini Flowers • American Gateway ILC 15
16
Contact Questions? Please contact: Lauren LeJeune 850-414-4726 Lauren.Lejeune@dot.state.fl.us 17
Recommend
More recommend