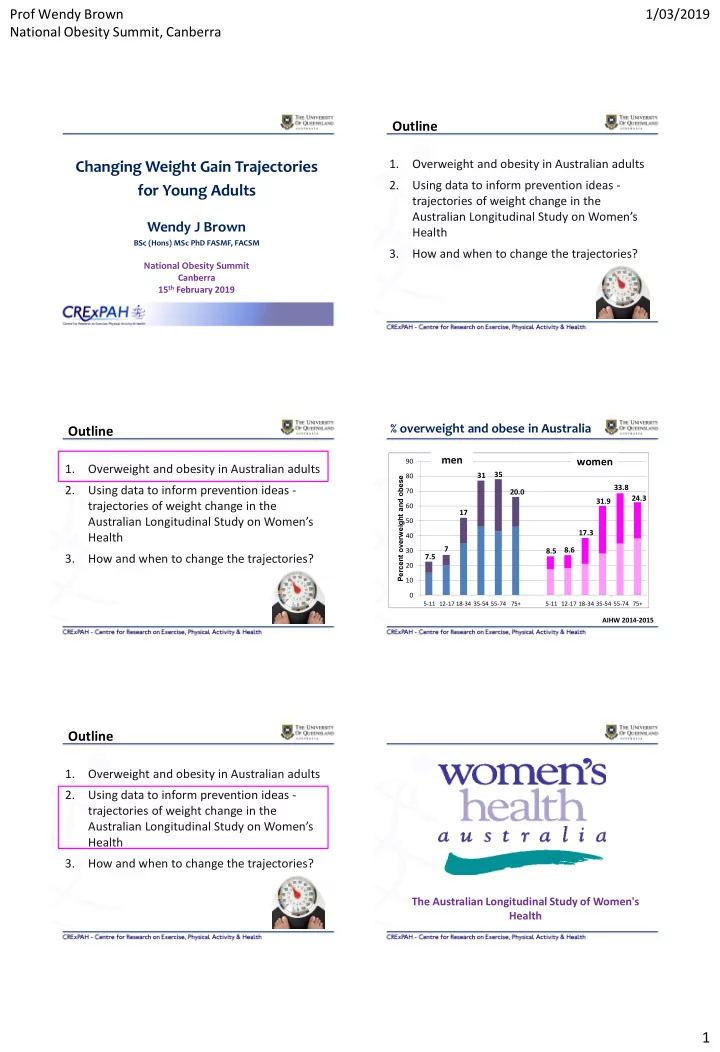

Prof Wendy Brown 1/03/2019 National Obesity Summit, Canberra Outline 1. Overweight and obesity in Australian adults Changing Weight Gain Trajectories 2. Using data to inform prevention ideas - for Young Adults trajectories of weight change in the Australian Longitudinal Study on Women’s Wendy J Brown Health BSc (Hons) MSc PhD FASMF, FACSM 3. How and when to change the trajectories? National Obesity Summit Canberra 15 th February 2019 % overweight and obese in Australia Outline men women 90 1. Overweight and obesity in Australian adults 31 35 80 Percent overweight and obese 33.8 2. Using data to inform prevention ideas - 70 20.0 24.3 31.9 trajectories of weight change in the 60 17 Australian Longitudinal Study on Women’s 50 17.3 Health 40 7 30 8.5 8.6 3. How and when to change the trajectories? 7.5 20 10 0 5-11 12-17 18-34 35-54 55-74 75+ 5-11 12-17 18-34 35-54 55-74 75+ AIHW 2014-2015 Outline 1. Overweight and obesity in Australian adults 2. Using data to inform prevention ideas - trajectories of weight change in the Australian Longitudinal Study on Women’s Health 3. How and when to change the trajectories? The Australian Longitudinal Study of Women's Health 1
Prof Wendy Brown 1/03/2019 National Obesity Summit, Canberra The Australian Longitudinal Study on Women’s Health The Australian Longitudinal Study on Women’s Health ALSWH Cohorts “new” young cohort established in 2012 Born: 1921-26 Born: 1946-51 1996: 70-75 y Born: 1973-78 Born: 1973-78 1989-95 1996: 45-50 y 1996: 18-23 y N= 12,432 1996: 18-23 y 2013 – 18-23y N=13,715 2019: 93-98y N= 14,427 N= 14,427 N= 17,011 2019: 68-73 2019: 41-46 y 2019: 41-46 y 2019: 26-29y all surveyed in 1996 then at ≈3 year intervals Methods – weight and height Weight change young adult women 1996 – age 18-23 to 2015 age 40-45; N 7000 2012 – age 18-23 to 2017 age 23-28; N 8000 At every survey: 80 800 78 By age 33 Weight and height self- 10 kg heavier? 76 g/year reported (women 74 72 2015 asked to check their 70 2017 68 weight on a scale) 600 66 2013 g/year 64 62 1996 60 21 25 28 31 34 37 40 1 2 3 4 5 6 7 8 9 10 11 12 13 14 15 16 17 18 19 20 Burton et al Aus NZ J Pub Health 2010 age Patterns of change in BMI Patterns of change in BMI 21% 32% 21% overweight/obese 45% 2
Prof Wendy Brown 1/03/2019 National Obesity Summit, Canberra Determinants of 10 y weight gain Obese 5.6 9.0 12.2 14.6 17.7 19.9 23.7 Overweight 14.9 18.8 20.4 23.8 25.0 26.9 27.2 Average rate of gain 0.93% of initial weight/year Healthy 79.6 72.2 67.3 61.6 57.3 53.3 49.1 100 605g (580-635) per year for 65kg woman 80 Partnered gained 1 kg more (than not) 60 Percent Partner + 1 baby gained 4kg more (than not) 40 Physical activity, sitting time, energy intake Education, hours paid work 20 Smoking, initial BMI 0 Survey 1 Survey 2 Survey 3 Survey 4 Survey 5 Survey 6 Survey 7 1996 2000 2003 2006 2009 2012 2015 18-23y 22-27y 25-30y 28-33y 31-36y 34-39y 37-42y Healthy weight Overweight Obese Brown et al Am J Prev Med 2010 Focusing on the healthy weight women Weight and time 11% obese 29% over- 4,881 women weight healthy BMI at baseline (1996: 18-23y) 59% 59.7 healthy, overweight, or obese BMI after 16-years healthy kg (2012: 34-39y) 18-23 22-27 25-30 28-33 31-36 34-39 Brown et al American J Prev Med 2016 Weight change over time Rates of weight change 3
Prof Wendy Brown 1/03/2019 National Obesity Summit, Canberra ORs for maintaining healthy BMI Determinants assessed in 2003 and 2009 GEE (adjusted models) MORE LIKELY University degree 1.50 (1.14-2.00) Low alcohol 1.25 (1.10-1.41) Physical activity mod 1.23 (1.03-1.47) 500-1000 high 1.44 (1.20-1.72) >1000 MET.min/week Brown et al Am J Prev Med 2016 ORs for maintaining healthy BMI weight sitting LESS LIKELY gain Separated/ widowed 0.77 (0.66-0.89) Smokers 0.64 (0.50-0.81) Sitting time 5-8h 0.87 (0.77-0.99) weight sitting >8h 0.78 (0.68-0.91) gain Energy Intake >11200 0.76 (0.58-0.99) chronic OCP 0.89 (0.80-0.99) disease Brown et al Am J Prev Med 2016 Outline High PA is the strongest behavioural 1. Overweight and obesity in Australian adults determinant of healthy weight maintenance 2. Using data to inform prevention ideas - >1000 MET.min/week trajectories of weight change in the Australian Longitudinal Study on Women’s 50 mins x 5 days x 4 METs Health 25 mins x 5 days x 8 METs 3. How and when to change the trajectories? 16 mins x 5 days x 12 METS (This is the upper end of current guidelines) 4
Prof Wendy Brown 1/03/2019 National Obesity Summit, Canberra Identify gainers early Changing the trajectories? Primary Care Identify those with weight gain <500g/ 1kg/>1.5kg /year at age 18-20 assist with behaviour change Add to RACGPs “red book” Develop accessible, culturally appropriate resources and education/training for all health professionals Chronic Disease Prevention Scheme 5 referrals to allied weight gain should be limited to <0.5kg per year health professionals (Exercise and Nutrition) Changing the trajectories? Scale up effective interventions (eg Help-her) If eating and activity (non-prescriptive simple health messages, small changes to behaviours could be behaviour, low participant burden, group- changed in women at this life stage . . based/individual/phone, SMS reminders etc) Integrate weight gain prevention into routine antenatal and if weight gain care (esp first birth at <26y) – incorporate AEPs and progression could be prevented . . Nutritionist/Dietitians for management of gestational weight gain and post partum healthy weight there would be potential Sustain participation in sport in the transition from school- for carry over to men and children as well. tertiary education-work and families www.alswh.org.au 5
Recommend
More recommend