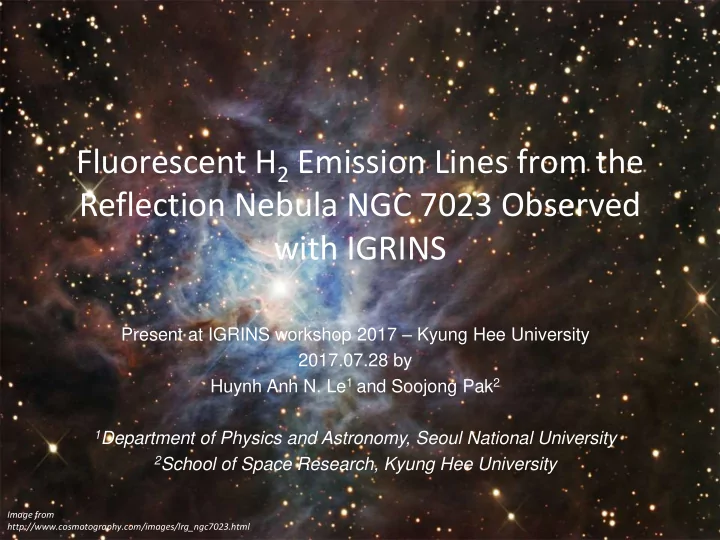

Fluorescent H 2 Emission Lines from the Reflection Nebula NGC 7023 Observed with IGRINS Present at IGRINS workshop 2017 – Kyung Hee University 2017.07.28 by Huynh Anh N. Le 1 and Soojong Pak 2 1 Department of Physics and Astronomy, Seoul National University 2 School of Space Research, Kyung Hee University Image from http://www.cosmotography.com/images/lrg_ngc7023.html
Molecular Hydrogen Observations in Molecular Clouds Horse head Iris Orion Crab M1
Molecular Hydrogen • The most abundant molecular Structure of H 2 • Tracing interaction bet, the star and rotation the cloud. – Shocked Region H H – Photodissociation Region vibration
H 2 Excitation Mechanism Thermal Non-Thermal Electrically Excited Collisional Excitation by Absorbing far-UV by shock and Radiates in IR bands in far-UV and IR bands
Thermal Collisional Excitation by shock in IR bands Rosenthal et al. (2000)
Non-Thermal Electrically Excited by Absorbing far-UV and Radiates in far-UV and IR bands Hora & Latter (1996)
H 2 Excitation – Line Intensity & Ratio Thermal by shocks Non-thermal by Far-UV Line ratio (2-1 / 1-0) C-shocks : ~ 0.2 PDR (n H2 < 5 x 10 4 /cm 3 ): ~ 0.6 J-shocks : < 0.5 dense PDR : < 0.6 slow J-shocks (< 24 km/s): < 0.3 Measured ratio = 0.3 ~ 0.5 possible mechanism: pure dense PDR pure J-shocks, C+J-shocks PDR + shocks
— fi — fi ¼ ¼ ¼ ‘‘ – (1),’’ fi fi fici fit ¼ ¼ ¼ ¼ fic fi H 2 Excitation – Ortho and Para Ratio TABLE 1 Branch Notation Branch J up J lo O..................... 2 P..................... 1 Q..................... 0 2.—Ene R..................... +1 ¼ ¼ S..................... +2 Shaw et al. (2005) Ortho-to-para-H2 ratio (OPR) OPR = 3 OPR < 3 Non-thermal by Far-UV Thermal by shock
Constellation: Cepheus NGC 7023 (Iris Nebula)
NGC 7023 (Iris Nebula) • Illuminated by HD 200775 (Herbig B3Ve-B5, T eff = 17,000 K) • PDRs in North and South from HD 200775 • D = 430 (+160/-90) pc • Clumpy structure ? (Martini+1999;1997) • Advancing PDR ? ( Fuente +2000) • Existing of shock ? ( Fuente +2000)
IGRINS - observations • Target: NGC 7023 • Date: 2014 July 12 (Commissioning) • Exposures: 2 x 600s / frame • Positions (Ra, Dec) J2000 = (21:01:36.9, +68:09:47.8) • Total exposure time: t = 1200 s, ON position t = 1200 s, OFF position
Le et al. 2017 Lemaire et al. (1996)
H 2 spectra
H 2 spectra • 68 H 2 rovibrational emission lines (v = 1 – 13 and J = 1 – 11) from Regions A, B, and C
Analysis • Dynamical Information from H 2 Lines • Emission line ratios • Ortho-to-para ratios • H 2 level population
De-convolution of Line Width ΔV FWHM V 3.64 0.16 4.63 0.34 Region A 3.46 0.11 3.29 0.26 Region B 3.39 0.22 3.20 0.27 Region C Sample Spectra: H 2 1-0 S(1)
Line Analysis Ortho-to-Para Ratio 2-1 S(1) / 1-0 S(1) (OPR) 0.41 0.01 1.82 0.11 Region A 0.48 0.02 1.75 0.09 Region B 0.56 0.03 1.63 0.12 Region C
Exc. Diag. of H 2 level Column Density: Region A
Exc. Diag. of H 2 level Column Density: Region B
Exc. Diag. of H 2 level Column Density: Region C
Comparison Data to PDR Model
Comparison Data to PDR Model
Comparison Data to PDR Model
Comparison Data to PDR Model
Derived Densities 5 = 0.01 pc 1 = 0.002 pc
Summary and Conclusion • We observed the NW filament of NGC Line ratio 7023 in H- and K-bands using the high (2-1 / 1- OPR V Δ V FWHM n H 0) spectral resolution spectrograph, IGRINS. 0.41 ± 1.82 ± 3.64 ± 4.63 ± • 10 5 We detected 68 H 2 rovibration lines 0.01 0.11 0.16 0.34 which are mostly UV excited. Dense regions show collisional de- 0.48 ± 1.75 ± 3.46 ± 3.29 ± 10 3 -10 4 0.02 0.09 0.11 0.26 excitation. • We suggest that: The presence of the 0.56 ± 1.63 ± 3.39 ± 3.20 ± dynamic PDR front relative to the molecular 10 3 -10 4 0.03 0.12 0.22 0.27 cloud. • We suggest that a high density (n H 10 5 cm -3 ) clump with 2.5 ± 0.3 – position offset 10′′ to the north a size of ~ 0.002 pc embedded in lower from ours (Martini+1997) density (n H 10 3 10 4 cm -3 ) regions.
Thank you!
Recommend
More recommend