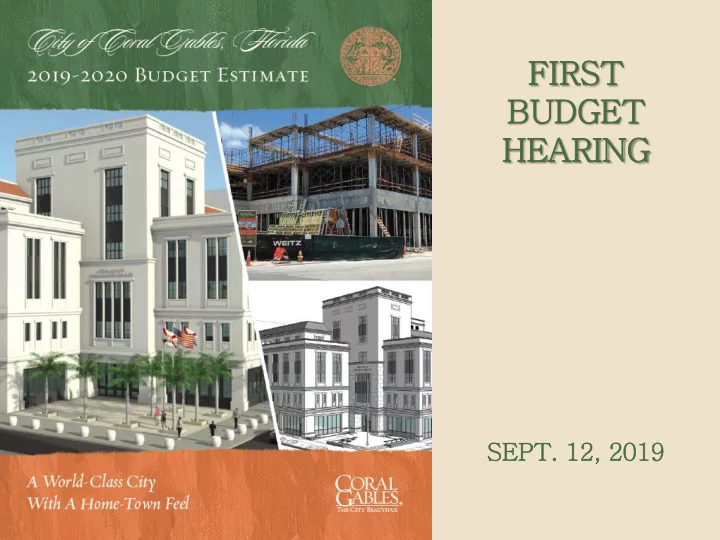

FIRST T BUDG UDGET HEAR EARING SEPT. 12, 12, 201 2019
2019 – 2020 BUDGET SIGNIFICANT CALENDAR DATES JUNE 1, 2019 – Property Appraiser sends estimated property values JULY 1, 2019 – Budget Estimate submitted to City Commission JULY 1, 2019 – Property Appraiser certifies preliminary taxable values JULY 1 to JULY 10, 2019 – State revenue estimates available online JULY 9, 2019 – Budget Workshop – Presentation of Budget Estimate JULY 10 to SEPTEMBER 11, 2019 – Individual Commission Briefings (As requested) AUGUST 4, 2019 – Certify tax rate to the Property Appraiser SEPTEMBER 12, 2019 – 1 st Budget Hearing SEPTEMBER 20, 2019 – 2 nd Budget Hearing 2
2019-2020 BUDGET SUMMARY Annual Revenues $ 198,950,998 Transfers From Reserves General Fund $ 14,826,608 Capital Improvement Impact Fee Fund 8,148,979 General Capital Improvement Fund 5,238,995 Transportation Fund 745,000 Roadway Improvement Fund 675,000 Storm Water Utility Fund 467,344 367,400 Automotive Fund Neighborhood Renaissance Program Fund 350,000 Retirement System Fund 170,047 All Other Funds 14,354 31,003,727 Total Revenues $ 229,954,725 Expenditures Operating 171,825,259 Capital 45,110,329 Debt Service 10,566,137 $ 227,501,725 Transfers to Reserves Sunshine State Debt Service Fund 1,855,000 General Capital Improvement Fund 260,000 All Other Funds 338,000 2,453,000 Total Expenditures $ 229,954,725 3
REVENUE INCREASES AFFECTING THE BUDGET Total Revenues Increases Revenue $ 4,896,543 $ 89,541,799 Property Tax * Development Agreement Contributions 2,700,000 2,700,000 General Fund Investment Earnings 1,700,000 2,310,000 Automobile Parking Fees 1,574,200 16,036,700 Stormwater Utility Fee 535,000 5,585,000 Fines & Forfeitures 490,833 2,452,833 Sanitary Sewer Fees 358,503 10,637,000 General Government Fees 305,000 2,570,000 Permit Fees 157,000 7,812,000 Transportation Sales Tax 150,000 2,200,000 Enterprise Funds Investment Earnings 147,000 270,000 Public Safety Fees 143,000 3,696,500 Other Revenue Increases 679,150 17,942,750 $ 13,836,229 Total Revenue Increases $ 163,754,582 * Property Tax estimate based on July 1 st property valuations. 4
REVENUE DECREASES AFFECTING THE BUDGET Total Revenues Decreases Revenue Intergovernmental Revenues $ (1,867,495) $ 6,089,000 Miami-Dade County Roadway Impact Fees (1,662,395) - Building Better Communities Bond Program (1,651,891) - Interfund Allocations (277,272) 2,524,864 Utility Service Taxes (216,000) 11,294,000 Parking Rentals & Concessions (102,537) 514,733 All Other Revenue Decreases (464,971) 14,773,819 Total Revenue Decreases (6,242,561) 35,196,416 Net Change/Total Revenues $ 7,593,668 $ 198,950,998 5
EXPENDITURE CHANGES AFFECTING THE BUDGET INCREASE TOTAL (DECREASE) BUDGET Personal Services (PS) $ 3,752,723 $ 72,196,796 Salaries (Longevity, Merits) (13,521) 2,367,382 Overtime Employee Benefits 741,165 Retirement 28,746,576 211,903 FICA 4,664,243 (1,686) Workers Compensation 2,000,000 90,724 Health & OPEB 8,911,335 (3000) Other Misc. Benefits 223,825 Total Change in Personal Services $ 4,778,308 Total Personal Services Budget $ 119,110,157 6
EXPENDITURE CHANGES AFFECTING THE BUDGET INCREASE TOTAL (DECREASE) BUDGET Other Than Personal Services (OTPS) Professional Services $ 136,630 $ 15,783,905 Repairs, Maintenance, Utilities & Misc. Services (446,295) 19,067,586 Parts, Supplies & IT Maintenance Subscriptions 294,708 8,714,044 Equipment Replacements (666,591) 518,323 Equipment Additions (952,334) 290,831 Debt, Employee Payouts & Contingencies 391,143 2,648,528 Grants (313,695) 811,389 Fleet Equip Replacement (1,826,141) 3,668,910 Non-Operating (261,112) 1,211,586 Total Change in Other Than Personal Services (3,643,687) Total Other Than Personal Services Budget 52,715,102 Net Change in Operating Budget $ 1,134,621 Total Operating Budget $ 171,825,259 7
PERSONNEL/BENEFITS ANALYSIS Total % of Total Total Salaries Total Benefits Salaries/Benefits Expenses City Commission $ 249,312 $ 190,203 $ 439,515 72.4% City Attorney 788,337 347,788 1,136,125 43.3% City Clerk 787,165 372,002 1,159,167 67.2% City Manager 1,540,302 646,460 2,186,762 76.7% Human Resources 964,202 621,879 1,586,081 77.0% Labor Relations & Risk Management 410,828 187,181 598,009 81.6% Development Services 5,042,048 2,920,937 7,962,985 79.3% Historic Resources & Cultural Arts 537,715 324,519 862,234 43.7% Public Works 13,178,415 8,677,970 21,856,385 40.4% Finance 2,736,529 1,364,005 4,100,534 87.5% Information Technology 1,670,567 798,762 2,469,329 41.4% Police 24,321,627 15,869,360 40,190,987 85.8% Fire 16,356,691 9,361,992 25,718,683 87.1% Community Recreation 3,512,563 1,404,412 4,916,975 49.9% Economic Development 545,563 279,885 825,448 55.4% Non-Departmental 100,542 146,685 247,227 5.7% Parking 1,821,772 1,031,939 2,853,711 29.8% Total Personnel/Benefits $ 74,564,178 $ 44,545,979 $ 119,110,157 63.0% 8
EMPLOYEE CLASSIFICATION TEN-YEAR COMPARISON FISCAL POLICE FIRE- GENERAL YEAR OFFICERS FIGHTERS EMPLOYEES TOTAL 2011 183 139 469 791 2012 183 139 469 791 2013 184 139 469 792 2014 191 139 470 800 2015 191 139 485 815 2016 192 139 498 829 2017 192 139 500 831 2018 192 139 506 837 2019 192 139 509 840 2020 * 193 139 514 846 * Proposed 9
NEW FULL TIME POSITIONS TITLE DEPARTMENT/DIVISION Electrical Inspector II Development Services - Building Project Managers (2) Public Works – Capital Improvement Police Lieutenant – F.O.P. Office Police – Administration Communications Operators (2) Police – Technical Services 10
CITY COMMISSION C.I.P. PRIORITIES Item Mayor Valdes-Fauli Vice-Mayor Lago Commissioner Fors Commissioner Keon Commissioner Mena No. Restoration of Fink Studio Citywide Traffic Calming Street Resurfacing 427 Biltmore Way Renovation Jaycee Park Enhancements 1 427 Biltmore Way Renovation Phillips Park Renovation/Enhancement Citywide Traffic Calming 405 Biltmore Way Restoration Phillips Park Renovation/Enhancement 2 405 Biltmore Way Restoration Biltmore Way Streetscape Citywide Pedestrian Infrastructure Flagler Neighborhood Improvements Citywide Traffic Calming 3 Assessment of Drainage & Repair of Development of Ponce De Leon Park LED Street Lights Conversion I.T. Infrastructure in Downtown Sunrise Harbor Sea Level Rise Mitigation Program 4 Street Resurfacing White Way Lights Restoration Sea Level Rise Mitigation Program I.T. Infrastructure in Downtown White Way Lights Restoration 5 Granada/Columbus Plaza Transportation North Ponce Tree Planting/Sidewalk Flagler Neighborhood Improvements Improvements North Ponce Streetscape Assessment LED Street Lights Conversion 6 Granada/Columbus Plaza Transportation Citywide Traffic Calming Citywide Pedestrian Infrastructure Wayfinding & Signage Program Improvements Blue Road Open Space Renovation 7 Biltmore Way Streetscape De Soto Traffic Circle Improvements 427 Biltmore Way Renovation Restoration of Fink Studio Salvadore Park Playground Expansion 8 Salvador Park Shade Structure Repair & Ponce De Leon Phase III Improvements Infrastructure Upgrades/FPL Assessment 405 Biltmore Way Restoration De Soto Traffic Circle Improvements Additions 9 North Ponce Tree Planting/Sidewalk De Soto Traffic Circle Improvements Jaycee Park Enhancements Assessment Biltmore Way Streetscape 427 Biltmore Way Renovation 10 Blue Road Open Space Renovation Restoration of Fink Studio Connectivity to Parks 11 11
Recommend
More recommend