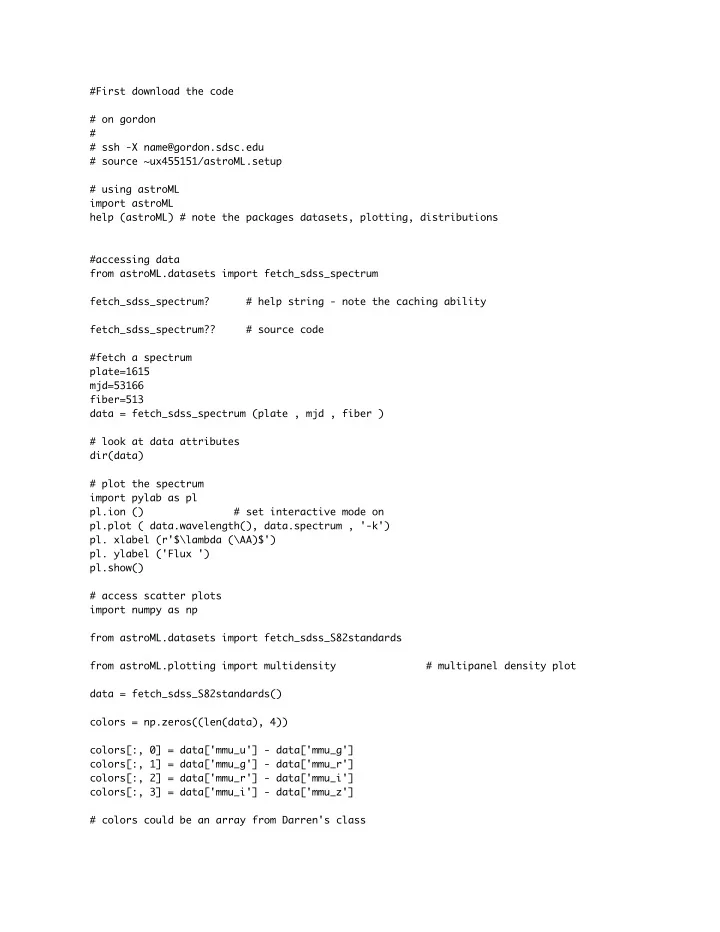

#First download the code # on gordon # # ssh -X name@gordon.sdsc.edu # source ~ux455151/astroML.setup # using astroML import astroML help (astroML) # note the packages datasets, plotting, distributions #accessing data from astroML.datasets import fetch_sdss_spectrum fetch_sdss_spectrum? # help string - note the caching ability fetch_sdss_spectrum?? # source code #fetch a spectrum plate=1615 mjd=53166 fiber=513 data = fetch_sdss_spectrum (plate , mjd , fiber ) # look at data attributes dir(data) # plot the spectrum import pylab as pl pl.ion () # set interactive mode on pl.plot ( data.wavelength(), data.spectrum , '-k') pl. xlabel (r'$\lambda (\AA)$') pl. ylabel ('Flux ') pl.show() # access scatter plots import numpy as np from astroML.datasets import fetch_sdss_S82standards from astroML.plotting import multidensity # multipanel density plot data = fetch_sdss_S82standards() colors = np.zeros((len(data), 4)) colors[:, 0] = data['mmu_u'] - data['mmu_g'] colors[:, 1] = data['mmu_g'] - data['mmu_r'] colors[:, 2] = data['mmu_r'] - data['mmu_i'] colors[:, 3] = data['mmu_i'] - data['mmu_z'] # colors could be an array from Darren's class
labels = ['u-g', 'g-r', 'r-i', 'i-z'] bins = [np.linspace(0.0, 3.5, 100), np.linspace(0, 2, 100), np.linspace(-0.2, 1.8, 100), np.linspace(-0.2, 1.0, 100)] multidensity(colors, labels, bins=bins) ########## PCA data = astroML.datasets.fetch_sdss_corrected_spectra() # read in set of data from sdss spectra = data['spectra'] lam = astroML.datasets.sdss_corrected_spectra.compute_wavelengths(data) spectra = spectra[:, :850] lam = lam[:850] # import scikit learn from sklearn.decomposition import RandomizedPCA spec_mean = spectra.mean(0) # use randomized PCA for speed n_components=5 pca = RandomizedPCA(n_components - 1) pca? # to see the attributes pca.fit(spectra) # perform the PCA (pca.components_ are the pca vectors) pca_comp = np.vstack([spec_mean, pca.components_]) # combine the components(and mean together) # plot the components pl.figure(figsize=(5, 10)) for i in range(n_components): pl.subplot(511 + i) pl.plot(lam, pca_comp[i, :]) ####### ICA # ICA treats sequential observations as related. Because of this, we need to fit with the transpose of the spectra from sklearn.decomposition import FastICA ica = FastICA(n_components - 1) ica.fit(spectra.T) ica_comp = np.vstack([spec_mean, ica.transform(spectra.T).T]) # plot ica results for i in range(n_components): pl.subplot(511 + i) pl.plot(lam, ica_comp[i, :])
########## NMF # NMF #from sklearn.decomposition import NMF # NMF can't handle negative fluxes #spectra[spectra < 0] = 0 #spectra = spectra[:100] #nmf = NMF(5, sparseness='components') #sources = nmf.fit(spectra) ########## Putting it all together #ipython-2.7 Dimension/pca-nmf-ica.py ########## LLE from sklearn import manifold, neighbors import lleFunc n_neighbors = 10 # specific number of neighbors out_dim = 3 # specify the dimensionality #read in data data = astroML.datasets.fetch_sdss_corrected_spectra() spec = astroML.datasets.sdss_corrected_spectra.reconstruct_spectra(data) # interpolates a spectrum astroML.datasets.sdss_corrected_spectra.reconstruct_spectra? color = data['lineindex_cln'] LLE = manifold.LocallyLinearEmbedding(n_neighbors, out_dim, method='modified', eigen_solver='dense') Y_LLE = LLE.fit_transform(spec) # plot RAW LLE coeffs = Y_LLE c = color lleFunc.spec_component_plot(coeffs, c) # excluding outliers flag = lleFunc.flag_outliers(Y_LLE, nsig=0.25) coeffs = Y_LLE[~flag] c = color[~flag] lleFunc.spec_component_plot(coeffs, c) ####### Your exercise ########### # Take the LLE and PCA code and generate the plots # http://www.astro.washington.edu/users/vanderplas/astrostats/html/auto_book_figures/ chapter7/figure7.9_1.html # http://www.astro.washington.edu/users/vanderplas/astrostats/html/auto_book_figures/ chapter7/figure7.8_1.html
# You will need to generate eigenvectors, project spectra onto these eigenvectors (remember the mean spectrum), plot the spectra
Recommend
More recommend