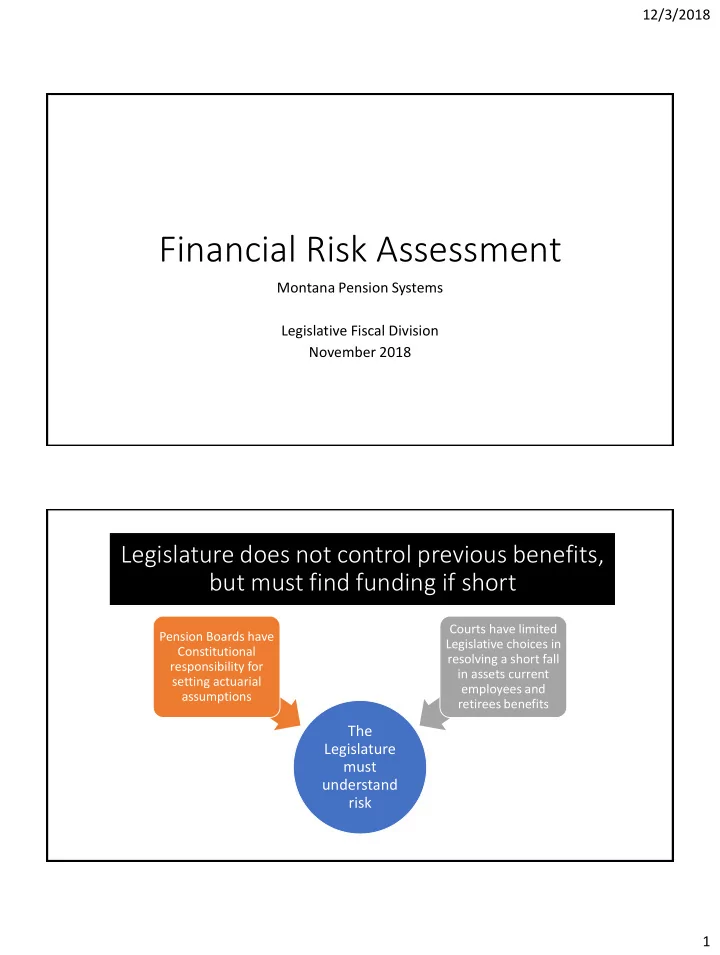

12/3/2018 Financial Risk Assessment Montana Pension Systems Legislative Fiscal Division November 2018 Legislature does not control previous benefits, but must find funding if short Courts have limited Pension Boards have Legislative choices in Constitutional resolving a short fall responsibility for in assets current setting actuarial employees and assumptions retirees benefits The Legislature must understand risk 1
12/3/2018 Previous PERS/TRS Pension Solutions: $140 million per year Reduced • Direct additional general fund Employee benefits pension contributions $80 million 15% 1% per year or over 3% of annual general fund spending • Employer contributions 1-2% increases will cap out at $40 million per year (~$4 million from GF) • Employee 1% contributions cap out Employer General at $21 million per year 28% Fund • Reduced benefits for future 56% employees impact small so far New general fund spending ~3.5% of all GF Order of Magnitude Comparisons 3,000.00 • GO Debt is relatively small 2,000.00 • Pension liabilities are larger 1,000.00 • State efforts to in recent years amortize (pay off) most of the - liability within 30 years Trusts GF GO Debt Pensions (1,000.00) • Pension unfunded liabilities are double the size of current state (2,000.00) trust funds including: (3,000.00) • School trusts, • Coal trusts, (4,000.00) • Tobacco trust, • Resource indemnity, and others (5,000.00) Net Asset Amortized Unamortized 2
12/3/2018 Whole area of 3 color box are the liabilities: discounted cost of future pension benefits Unfunded Assets: Funded portion of the liabilities Amortized Unamortized Assets (bonds & equities) = Funded portion of the Amortized: liabilities Actuaries use all payments into and out of the system to Another key term is Funded Ratio determine if the unfunded Unamortized Funded ratio = assets/liabilities portion of the liabilities will portion of the amortize or be paid off within liability is the 30 years. amount that does not amortize in 30 years Slide Number 5 $16 billion in discounted benefits owed with about 70% funded with assets Unfunded ($4.5 bi) Assets: Funded (~$11.5 bi) C. Amortize D. Unamortized in 30 yr ($0.2 ($4.3 bi) bi) Slide Number 6 3
12/3/2018 What is the impact to the state if the assumptions are wrong? Likelihood Cost of Risk of Risk to State Risk Assessment: what do different assumptions yield Unfunded Assets: Funded C. Amortized in 30 D. Unamortized in 30 years years 8 4
12/3/2018 Risk Assessment: New Actuary Standard • Actuarial Standards Boards issued Actuarial Standard of Practice 51(ASOP 51) entitled “Assessment and Disclosure of Risk Associated with Measuring Pension Obligations and Determining Pension Plan Contributions” • Requires actuaries to better educate interested parties about risks facing their plans • Educate interested parties on the potential for future plans’ health to differ from expected results. Identify realistic risks to the system such as investment risks, contribution risks, longevity, etc • If returns on investment are lower than the assumed rate, what increase in contributions would be required to still fully amortize? • Also provides a way to incorporate states overall economic conditions, tax collections, and history of making required contributions to inform policy Stress Testing Recommendations 1. Baseline Projections: These are already provided in the actuarial valuations and include information such as assets, unfunded liabilities, employee/employer contributions, funded ratio, amortization period, etc. 2. Low Returns Scenario: New projections of the items in (1) and the additional ARC (annual required contribution) if the investment returns are two percentage points below the assumed rate or if returns are fixed at 5%. 3. Recession, Followed by Slow Growth: Projections of the items in (1) and the additional ARC if there is a significant loss of assets (one-year loss to assets of 20 percentage points), followed by a period of where investment returns are two percentage points below plan assumptions. 4. Simulation Analysis: Projections of the items in (1) and the additional ARC based on an analysis assuming expected returns at both the 25 th and 75 th percentile as determined by the Board of Investments. 5. Sensitivity Analysis: Pension liabilities and service cost for each tier, for the most recent year available, calculated at both the assume rate of return and using a discount rate based on the state’s average long-term borrowing cost. Past 20 Years’ Experience Simulation: Use the last 20 years’ pension funds return on investments to 6. simulate the next 20 years. Calculate the projections from item (1) at the end of the 20 years. 5
12/3/2018 Legislative Information Option Legislature ask for analysis of long term risk Pension Boards approve risk assessment criteria December 2018 to Actuaries analyze & report June 2019 June 2019 July 2019 to December 2019 15,000.00 10,000.00 5,000.00 - Details of Trusts GF GO Debt Pensions Accounting (5,000.00) (10,000.00) (15,000.00) (20,000.00) Asset Funded Liability Unfunded Liability Amortized Unfunded Unamortized liability 6
Recommend
More recommend