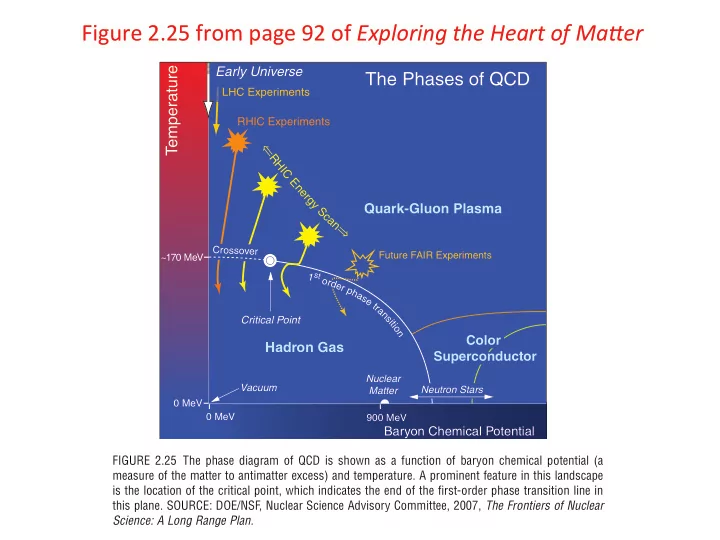

Figure ¡2.25 ¡from ¡page ¡92 ¡of ¡ Exploring ¡the ¡Heart ¡of ¡Ma2er ¡ Temperature Early Universe The Phases of QCD LHC Experiments RHIC Experiments R H I C E n e r g y Quark-Gluon Plasma S c a n Crossover Future FAIR Experiments ~170 MeV s 1 t o r d e r p h a s e t r a n s Critical Point i t i o n Color Hadron Gas Superconductor Nuclear Vacuum Neutron Stars Matter 0 MeV 0 MeV 900 MeV Baryon Chemical Potential FIGURE 2.25 The phase diagram of QCD is shown as a function of baryon chemical potential (a measure of the matter to antimatter excess) and temperature. A prominent feature in this landscape is the location of the critical point, which indicates the end of the first-order phase transition line in this plane. SOURCE: DOE/NSF, Nuclear Science Advisory Committee, 2007, The Frontiers of Nuclear Science: A Long Range Plan.
Figure ¡2.20 ¡from ¡page ¡82 ¡of ¡ Exploring ¡the ¡Heart ¡of ¡Ma2er ¡ FIGURE 2.20 The ratio of the shear viscosity of a fluid to its entropy density, denoted η / s , can be thought of as the “imperfection index” of a fluid, since it measures the degree to which internal fric- tion damps out the flow of the fluid. Quantum mechanics dictates that there are no fluids with zero imperfection index. The two most perfect fluids known are the trillions-of-degrees-hot quark-gluon plasma that filled the microseconds-old universe and that today is produced in heavy ion collisions at RHIC and the LHC, and the millionths-of-degrees-cold fluid made from trapped atoms with the interaction between atoms tuned to the maximum possible. For comparison, the imperfection indices of several more familiar liquids are also shown. Gases have imperfection indices in the thousands. The imperfection index is defined as 4 πη /s because it is equal to one in any of the many very strongly coupled plasmas that have a dual description via Einstein’s theory of general relativity extended to higher dimensions. Via this duality, 4 πη /s =1 is related to long-established and universal properties of black holes. Quark-gluon plasma is the liquid whose imperfection index comes the closest to this value. SOURCE: Adapted from U.S. Department of Energy, 2009, Nuclear Physics Highlights , Oak Ridge National Laboratory Creative Media Services. Available at http://science.energy.gov/~/media/ np/pdf/docs/nph_basicversion_std_res.pdf.
Figure ¡2.21 ¡from ¡page ¡85 ¡of ¡ Exploring ¡the ¡Heart ¡of ¡Ma2er ¡ FIGURE 2.21 When the almond-shaped initial geometry in an off-center heavy ion collision at RHIC expands as a nearly perfect fluid, it explodes with greater momentum in the direction in which the initial almond is narrowest. SOURCE: Courtesy of Brookhaven National Laboratory.
Figure ¡2.22 ¡from ¡page ¡87 ¡of ¡ Exploring ¡the ¡Heart ¡of ¡Ma2er ¡ Number of energetic particles Jet quenching at RHIC p+p 0.2 d+Au Au+Au 0.1 0 -1 0 1 2 3 4 5 (radians) FIGURE 2.22 The extinction of the away-side jet. Collimated patterns of jet particles are observed at ∆Φ = π opposite a trigger particle at ∆Φ = 0 in p + p and d + Au collisions but are completely absent in Au + Au collisions. SOURCE: Adapted from DOE/NSF, Nuclear Science Advisory Committee, 2007, The Frontiers of Nuclear Science: A Long Range Plan.
Figure ¡2.22 ¡from ¡page ¡87 ¡of ¡ Exploring ¡the ¡Heart ¡of ¡Ma2er ¡ Number of energetic particles Jet quenching at RHIC p+p 0.2 d+Au Au+Au 0.1 0 -1 0 1 2 3 4 5 (radians) FIGURE 2.22 The extinction of the away-side jet. Collimated patterns of jet particles are observed at ∆Φ = π opposite a trigger particle at ∆Φ = 0 in p + p and d + Au collisions but are completely absent in Au + Au collisions. SOURCE: Adapted from DOE/NSF, Nuclear Science Advisory Committee, 2007, The Frontiers of Nuclear Science: A Long Range Plan.
Figure ¡2.23 ¡from ¡page ¡88 ¡of ¡ Exploring ¡the ¡Heart ¡of ¡Ma2er ¡ 1 Photons from a Heavy Ion Collision PHENIX DA T A -1 10 Thermal photons Prompt photons from -2 10 initial hard collisions Photon Yield Sum: Thermal + Prompt -3 10 -4 10 -5 10 1 2 3 4 5 6 7 Photon T ransverse Momentum (GeV/c) FIGURE 2.23 The measured photon radiation spectrum in Au + Au collisions at RHIC is compared to the spectra expected from photons created by hard collisions in the initial stages of the collision (black curve), from thermal photons radiated by a QGP with an initial temperature (0.33 fm/c after the collision) of 370 MeV (red curve) and from the sum of these processes (blue curve). SOURCE: Courtesy of the PHENIX Collaboration.
Figure ¡2.24 ¡from ¡page ¡90 ¡of ¡ Exploring ¡the ¡Heart ¡of ¡Ma2er ¡ RHIC Au+Au √ s NN = 200 GeV (PHENIX) p (PHENIX) 0.3 K (PHENIX) (STAR) 0.10 K 0 (STAR) (STAR) s Baryons (n q =3) 0.2 v 2 /n q v 2 0.05 Mesons (n q =2) 0.1 0 0 1 2 3 0 0.5 1 1.5 1 KE T (GeV) KE T /n q (GeV) FIGURE 2.24 The strength of the elliptic flow (v 2 ) is plotted as a function of the transverse kinetic energy KE T for various particle species including mesons (pions and kaons) and baryons (protons, Lambdas, and Xi’s) produced in heavy-ion collisions at RHIC (left-hand panel). The right-hand panel shows that the differences between mesons and baryons are eliminated when these quantities are computed on a per-quark basis, strongly suggesting that the flow pattern is determined in the QGP phase. SOURCE: DOE/NSF Nuclear Science Advisory Committee, 2007, The Frontiers of Nuclear Sci- ence: A Long Range Plan.
Recommend
More recommend