EXPOSITION CORRIDOR TRANSIT NEIGHBORHOOD PLAN SPRING 2014 Los - PowerPoint PPT Presentation
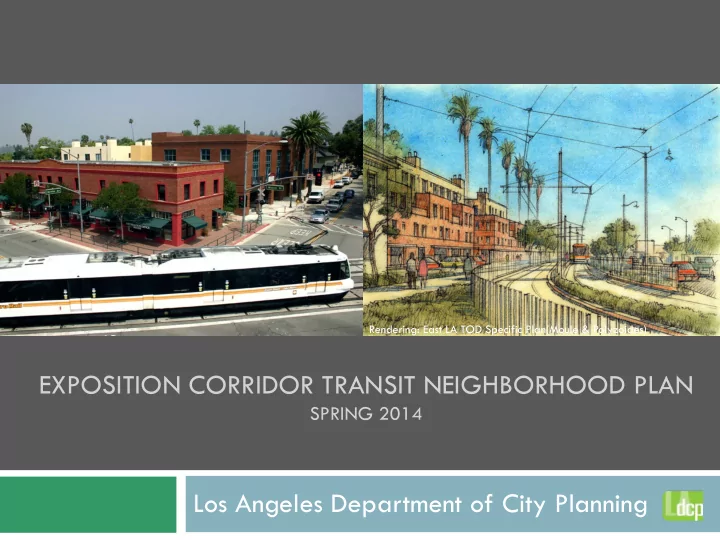
Rendering: East LA TOD Specific Plan(Moule & Polyzoides) EXPOSITION CORRIDOR TRANSIT NEIGHBORHOOD PLAN SPRING 2014 Los Angeles Department of City Planning About the Project Expo Corridor Transit Neighborhood Plan Specific Plan for
Rendering: East LA TOD Specific Plan(Moule & Polyzoides) EXPOSITION CORRIDOR TRANSIT NEIGHBORHOOD PLAN SPRING 2014 Los Angeles Department of City Planning
About the Project Expo Corridor Transit Neighborhood Plan Specific Plan for area ½ mile around Expo Line Phase 2 Guide for future development through 2035 Funded by a grant from Metro Goals Increase transit ridership Reduce greenhouse gas emissions Encourage infill development near transit Create vibrant transit neighborhoods (“placemaking”)
Expo Corridor Transit Neighborhood Plan Expo Line Phase 2 to Santa Monica opening in 2015 – 2016. Five stations (4 new) in the City of Los Angeles.
Planning Context
City Council Adopted Policy Framework General Plan Framework (1996) Housing and employment growth near transit Preserve stable single family neighborhoods Improve urban form and neighborhood design Industrial Land Use Policy (2008) Reinforced previous policy to preserve industrially-zoned land Recommended new industrial zones tailored for specific areas in West LA West Los Angeles, Palms-Mar Vista, and West Adams Community Plan Areas Regulations must be consistent with Community Plans
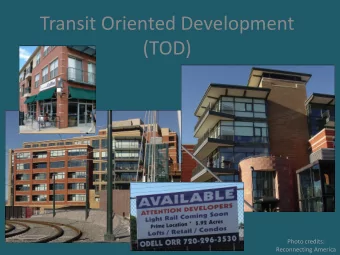
What Are Transit Neighborhoods? Transit Neighborhoods (also known as Transit Oriented Districts or TODs): are within an easy walk of transit stop. comprise a wide mix of uses. concentrate new development near transit. are designed for pedestrians and bicyclists while still accommodating cars.
Why Plan Near Transit? Reduce greenhouse gases (auto dependence) Improve mobility options Preserve single family neighborhoods
Patterns of Transit Use 2013 study of the Expo Line Phase I showed households within a half-mile of a station: tripled their rail ridership reduced their daily driving by 40% reduced vehicle miles traveled by 10-12 miles/day Studies of other neighborhoods near transit have shown similar reductions in vehicle travel and increased ridership.
Patterns of Transit Use Rail ridership is highly dependent on proximity to stations Within ¼ mile of station, higher ridership among workers compared to residents. Beyond ¼ mile from station, higher ridership among residents compared to workers. 10.5% 9.7% Source: 2011 Report from Public Policy Institute of California
Land Use & Employment Trends Anticipated trends show that, between 2008 to 2035, West LA’s CPAs * are expected to have a higher rate of housing growth than adjacent cities ** . Over the same period, West LA’s rate of growth in jobs is expected to be equivalent to adjacent cities. Growth in Households and Jobs 2008 -2035 25% 21% 20% 15% 9% 9% 7% 10% 5% 0% Households Jobs West LA CPAs Westside Cities *Includes Community Plan Areas (CPAs) of Westwood, West Los Angeles, Palms-Mar Vista-Del Rey, and Venice. **Includes Santa Monica, Beverly Hills, West Hollywood, and Culver City. Source: Southern California Association of Governments (SCAG) 2012 RTP
Land Use & Employment Trends Results of Market Demand Study showed: Expo Corridor is an important jobs area today, especially at Bundy. Strong demand for both jobs and housing in the future Estimated demand for the Expo Corridor in 2035: 3,800 to 6,400 dwelling units 3 to 6 million square feet of non-residential use Includes office (4.28 million sf), industrial, and retail Strong office potential around Bundy and Sepulveda stations. Strong demand for housing and neighborhood-serving retail around Palms station.
Land Use & Employment Trends Maintaining land for jobs is important to: Meet the estimated demand for jobs in 2035 Preserve the City’s tax base to pay for essential City services Maintain the City’s competitiveness in growing industries Capture share of job growth occurring in neighboring Westside cities
Plan Elements Land Use and Zone Changes Public Benefits Urban Design Standards Streetscape Plans
Land Use and Zone Changes Develop four new zones and re-zone strategic areas to: Position industrial land near stations to accommodate jobs and limited retail and housing. Allow greater residential development in select industrial areas. Encourage mixed use on key commercial corridors. Create more capacity for housing in key locations. Changes apply to 255 acres within the the Plan area (1,970 acres) Areas that have no land use and zone changes will still be subject to urban design standards, with the exception of single-family properties. Current Code-required parking ratios apply, except in limited circumstances.
Land Use and Zone Changes New Zoning Designations Zoning Districts Purpose Examples • Encourage creative, high tech uses. New Industry • Promote clusters of industries and synergies between users. • Provide amenities to support job clusters. • Enable uses that create jobs, such as creative and Hybrid commercial office. Industrial: • Ensure a mix of retail, entertainment and limited Jobs Emphasis residential. Hybrid • Encourage job-creating uses that are compatible with Industrial: residential uses. Residential • Residential developments that incorporate jobs and ground floor activity. Emphasis • Encourage traditional residential/commercial mixed-use Mixed-Use: development while still allowing for all-commercial Commercial/ buildings Residential • May allow larger retail uses, depending on location
Land Use and Zone Changes
Land Use and Zone Changes Alternative Compliance Process Maintains proposed plan levels of development Shifts to a mix of uses that allows more housing (subject to a cap) Increased housing is offset by less commercial square footage Projects would be required to provide greater public benefits. Flexibility in land uses to respond to market demand Allow housing in the near-term Maintain opportunities for job growth in long term Applies to select properties
Public Benefits All proposed development within the new zones is required to provide baseline amenities, such as streetscape improvements (on-site); open space; public paseos; and parking management strategies, as relevant. Additional public benefits are required for projects seeking greater development rights, and may include: Mobility hubs Publicly accessible open space Transportation demand management strategies Transit and bike amenities Off-site streetscape improvements Affordable housing
Urban Design Standards Transitional Height Requires development that is adjacent to R1 and R2 to step back building height away from that use. Addresses potential for new development to “overshadow” existing homes. Indicates location of transitional height requirement
Urban Design Standards Transitional Height Requires development that is adjacent to R1 and R2 to step back building height away from that use. Addresses potential for new development to “overshadow” existing homes. North side of Pico South side of Pico Applies to areas such as the proposed RAS4 zone on Pico Blvd (illustrated above)
Urban Design Standards Retail and Active Streets Ensure ground floor of buildings is activated to create a safe and interesting pedestrian environment.
Urban Design Standards Retail and Active Streets Retail Streets – Ground floor to have retail uses, i.e. shops, restaurants, services. Active Streets – Ground floor to have active uses, i.e. lobbies, public spaces, residential entries, or retail.
Streetscape Plans Configure streets to accommodate multiple modes. Incorporate trees, landscaping and street furniture. Ensure sufficient sidewalk widths. Incorporate bicycle facilities as appropriate. Maintain vehicular circulation. Charlotte San Francisco
Results and Analysis
Plan Capacity: Housing
Plan Capacity: Jobs
Mobility Benefits With Proposed Expo TNP and Mobility Plan, a 3.1% decrease in VMT per capita in 2035 is anticipated, resulting from: Shorter vehicle trips More non-vehicular trips Internalization of trips (mixed use) Vehicle Miles Traveled (VMT) within West LA APC Service Population Total VMT VMT per capita (Employees + Residents) Existing (2013) 10.5 million 742,518 14.22 Future (2035)* 11.5 million 833,502 13.79 % Change +8.9% +12.2% -3.1% *Assumes Proposed Expo TNP + Mobility Plan 2035
Mobility Benefits With Proposed Expo TNP an increase in use of non-vehicular modes within the West LA APC area in 2035 is anticipated. 17% increase in transit 11% increase in bike 1% increase in walking
Contact us Patricia Diefenderfer patricia.diefenderfer@lacity.org 213.978.1170 David Olivo david.olivo@lacity.org Visit us at www.latnp.org 213-978-1205 for project updates and to join our mailing list. Lameese Chang lameese.chang@lacity.org 213-978-1178
Recommend


More recommend
Explore More Topics
Stay informed with curated content and fresh updates.