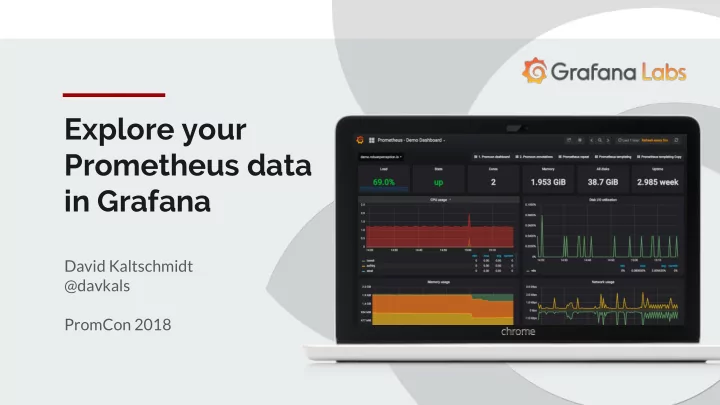

Explore your Prometheus data in Grafana David Kaltschmidt @davkals PromCon 2018
I’m not Carl Carl is having a great time on parental leave
I’m David All things UX at Grafana Labs If you click and are stuck, reach out to me. david@grafana.com Twitter: @davkals
Grafana From Dashboarding solution To Observability platform
queries only the last datapoint Instant query best displayed in table panel
Table row merge on labels
Step alignment “Jumpy” rate graphs Align start/end parameters to step
Heatmap panel released in 5.1 Query: rate(foo_metric_bucket[10m]) Legend format: {{le}} Format as: Heatmap
Summer intern project (Tobias, tak!!) New built-in variable: $__range Variable expansion in template variables Dashboard-range-based variables
Template variable expansion
Use range-based template variables in queries
Provisioning API Define data sources and dashboards in files Auto-reload on change http://docs.grafana.org/administration/provisioning/ Allows version control of files
Grafana is now fully CI’ed Test new features that are in master: docker run -d --name=grafana -p 3000:3000 grafana/grafana:latest https://hub.docker.com/r/grafana/grafana/
Prometheus adoption
2.8K 36K PromCon 2016
16K 2.8K 36K 92K PromCon 2016 2017
16K ?K 2.8K 36K 92K 186K PromCon 2016 2017 2018
16K 54K 2.8K 36K 92K 186K PromCon 2016 2017 2018
New: Explore UI (Alpha)
Motivation Dashboard UI is made for building dashboards, not query iteration. “I just want to quickly…”
Motivation once panel is found, difficult to interact with overwhelming style and display options
Motivation Incident response currently happens elsewhere! User story: As an SRE, I want to investigate a certain aspect or incident of my infrastructure. I’m already looking at the right dashboard panel and have formed a hypothesis. From here I want to quickly run variations of the panel’s query to verify my hypothesis. The panel I started from should stay unaffected.
First tab Second tab 3rd tab My tab ╳ GRAPH TABLE BOTH Last 1 hour, Refresh: 10s . . . GRAPH TABLE BOTH Last 1 hour, Refresh: 10s . . . RUN RUN rate(http_requests_total[5m]) 4.2s rate(http_requests_total[5m]) 4.2s 1 - rate(http_requests_total[5m]) 1 - rate(http_requests_total[5m]) 3.2s 3.2s rate(http_requests_total[5m]) rate(http_requests_total[5m]) 1 - rate(http_requests_total[5m]) 1 - rate(http_requests_total[5m]) Explore UI wireframes
Demo: http://localhost:3333/explore
Enable Explore UI Behind feature flag. To enable, edit Grafana config ini file [explore] enabled = true Set up a datasource that supports Explore, e.g., Prometheus. Will be released in 6.0
What we’re working on
Explore UI needs to be refined still behind feature flag, feedback welcome: @davkals or david@grafana.com Prometheus metric metadata from HELP line in the exposition support for completion for foo_metric / on(|) group_left(|) bar_metric design doc for explore components for other datasources bring query field over to panel editor
MultiStat panel https://github.com/grafana/grafana/pull/12620
Dashboard management Improve Grafana’s integration with Mixins (see Tom Wilkie’s talk) Git integration to save changes back Defaults for panel configs
One more thing...
Logging is coming to Grafana
Tak for listening UX feedback to david@grafana.com @davkals
Tak for listening UX feedback to david@grafana.com @davkals
Recommend
More recommend