Explanatory and Response Variables People make claims about their - - PDF document

explanatory and response variables
SMART_READER_LITE
LIVE PREVIEW

Explanatory and Response Variables People make claims about their - - PDF document

Explanatory and Response Variables People make claims about their world all the time. If had more money I would be happier If become a vegetarian I will be healthier Global warming is caused by human activity I


slide-1
SLIDE 1

Explanatory and Response Variables

People make claims about their world all the time.  “If had more money I would be happier”  “If become a vegetarian I will be healthier”  “Global warming is caused by human activity”  “I can get a good job if I go to college”. Inherent in these claims is the idea that there is a meaningful relationship (or association) where one characteristic or quantity (variable) influences the outcome or value of another quantity (variable). They believe that somehow one of the variables explains/predicts the value of the other variable. How do these people know if their claims are true? How can we test their claims? Beginning to understand how to answer these questions starts with first exploring the concept

  • f explanatory (predictor) variables, response variables, and association.

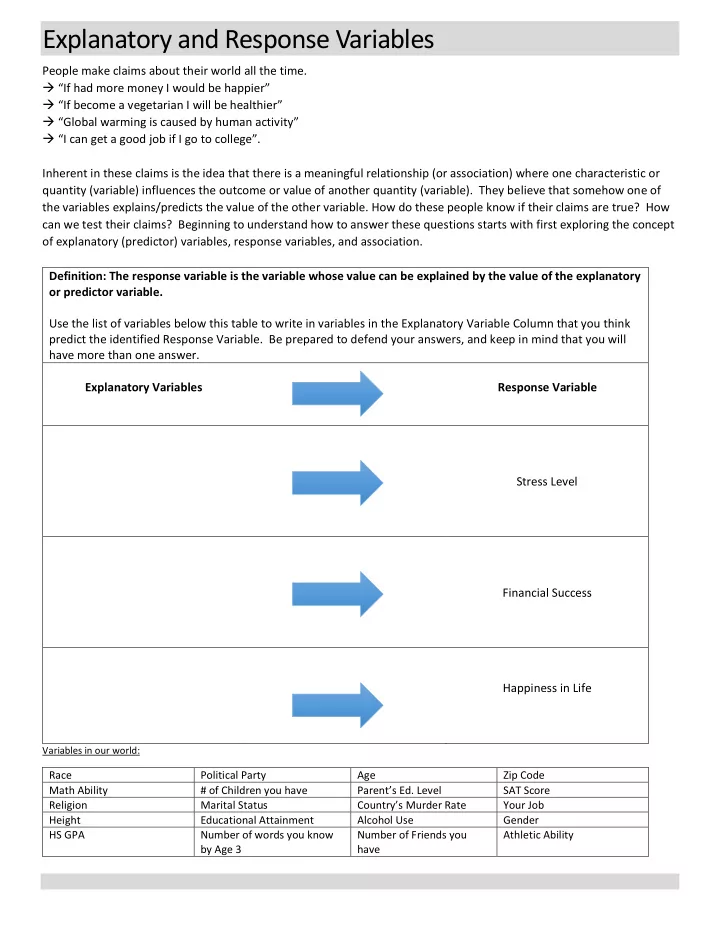
Definition: The response variable is the variable whose value can be explained by the value of the explanatory

  • r predictor variable.

Use the list of variables below this table to write in variables in the Explanatory Variable Column that you think predict the identified Response Variable. Be prepared to defend your answers, and keep in mind that you will have more than one answer. Explanatory Variables Response Variable Stress Level Financial Success Happiness in Life

Variables in our world:

Race Political Party Age Zip Code Math Ability # of Children you have Parent’s Ed. Level SAT Score Religion Marital Status Country’s Murder Rate Your Job Height Educational Attainment Alcohol Use Gender HS GPA Number of words you know by Age 3 Number of Friends you have Athletic Ability

slide-2
SLIDE 2

SAMPLING AND DATA: DATA COLLECTION ACTIVITY LAB

In this activity, you will explore how different sampling techniques are implemented and how they affect the samples you obtain. You will pick samples using the list of restaurants below. Entrée Cost  $ $$ $$$ $$$$ Santa Ana

Los Reyes Del Elote Dog Haus The BurgerStop Kebab Place Soho Taco Playground The Barrel Room Soltani Sushi Murasaki Antonello La Casa Playground 2.0 Morton’s

Anaheim

Nicky Rottens Broken Yolk Old Spaghetti Factory BoliloTortas Tin Fish The Hopping Pig Hard Rock Café Star of India Rama Thai Field Irish Pub Urban Bar & Grill Rei do Gado Searsucker Nobu Bella Lune

Newport Beach

Veg-N-Out Thai Time Cardamom Café Saguaro’s Zenseu Sushi Eddie’s Place Harar Ethiopian Casa de Luz Urban Solace Il Postino The Smoking Goat Sabuku Sushi

Irvine

Board & Brew Tabu Sushi Urban Pi Harry’s Coffee Shop Le Bambou El Pescador Little Korea Sbicca Nine Ten Whiskandladle Jake’s Del Mar Poseidon George’s at the Cove Roppongi

Orange

Han and Harry’s Royal Mandarin Souplantation Kanpai Sushi House Ono’s Café Golden Chopsticks Miguel’s Cocina

Romesco Baja Bistro La Quinta Grill Casa Bella

Butcher Shop

Costa Mesa

Spiro’s Gyros Village Pizzeria Otis’s Place Lil’ Piggy’s BBQ Leroy’s Kitchen Costa Azul McP’s Irish Pub Il Fornaio Brigantine Sapori Current Primavera Ristorante 1500 Ocean Stake Chophouse

Fountain Valley

Rocky’s Crown Pub Kono’s Surf Club Los Dos Pedros Sundara Sushi Ota Costa Brava OB Noodle House Tweety Thai The Fishery Isabel’s Cantina Kafe Yen Nick’s at the Beach Jrdn Tower 23

  • I. SIMPLE RANDOM SAMPLE:

Describe the details of the procedure: II: SYSTEMATIC SAMPLE: Describe the details of the procedure:

  • III. STRATIFIED SAMPLE:

Describe the details of the procedure:

  • IV. CLUSTER SAMPLE:

Describe the details of the procedure:

slide-3
SLIDE 3

Kahoot Activity – Online

Percentiles Activity

Finding the percentile of a value, x.

1) In your own words, describe how to find the percentile of a value, x.

  • a. From the class data, find the percentile of the following score: ________
  • b. Example: From the class data, find the percentile for your score: ________

Finding the value at the k-th percentile.

1) What is formula to find L? 2) What does L represent? 3) What would you do if L is NOT a whole number? 4) What would you do if L is a whole number? 5) From the class data, find the 85th percentile 6) From the class data, find the 50th percentile (Q2) 7) From the class data, find P32

slide-4
SLIDE 4

Boxplot Activity

Review

1) What is the 5 number summary? ____, ____, ____, ____, ____ 2) What are the formulas for the Lower Fence and Upper Fence? UF: LF: 3) A number is an outlier if it is ____________ the Lower Fence and ____________ the Upper Fence.

The Activity

Part I: How long can you hold your breath?

  • a. On your cell phone or on google, find a stopwatch.
  • b. Hold your breath and start the stopwatch. Hold your breath as long as you can, then stop the

stopwatch.

  • c. Record the time here: I held my breath for ______ seconds.

Part II: Verbal Memory Test

  • a. www.humanbenchmark.com
  • b. Click on “Verbal Memory”
  • c. Once you finish the game, record your score here: ____

The Analysis

How long can you hold your breath? Verbal Memory Test Min: Min: Q1: Q1: Q2: Q2: Q3: Q3: Max: Max:

Lower Fence: Lower Fence: Upper Fence: Upper Fence: Outliers: Outliers:

slide-5
SLIDE 5

Card Tricks

  • 1. Multiplication Rule

https://www.youtube.com/watch?v=CmfgxPy_Ehk

  • 2. Tree Diagrams

https://www.youtube.com/watch?v=M1dhAG2bsrQ

  • 3. Conditional Probability

https://www.youtube.com/watch?v=oLjEulT6ssM

slide-6
SLIDE 6

Intro to Probability

Directions:

  • 1. Find a partner (or two… but no more than 3 in a group)
  • 2. Come get a pair of dice
  • 3. Partner 1 rolls the dice, while partner 2 records the sum. Do this 15 times.
  • 4. Partner 2 rolls the dice, while partner 1 records the sum. Do this 15 times.
  • 5. At the end, count the total number of 2s, 3s, 4s, etc. for both partners, and fill out the table.

Partner 1: Sum of Dice 1. 2. 3. 4. 5. 6. 7. 8. 9. 10. 11. 12. 13. 14. 15. Totals (for both Partners) # of times the Sum was 2: ______ # of times the Sum was 3: ______ # of times the Sum was 4: ______ # of times the Sum was 5: ______ # of times the Sum was 6: ______ # of times the Sum was 7: ______ # of times the Sum was 8: ______ # of times the Sum was 9: ______ # of times the Sum was 10: ______ # of times the Sum was 11: ______ # of times the Sum was 12: ______ Partner 1: Sum of Dice 1. 2. 3. 4. 5. 6. 7. 8. 9. 10. 11. 12. 13. 14. 15. Partner 2: Sum of Dice 1. 2. 3. 4. 5. 6. 7. 8. 9. 10. 11. 12. 13. 14. 15. Partner 3: Sum of Dice 1. 2. 3. 4. 5. 6. 7. 8. 9. 10. 11. 12. 13. 14. 15.

slide-7
SLIDE 7
slide-8
SLIDE 8

Roll and Win

Directions:

  • 1. Find a partner (only two people in a group)
  • 2. Come get a pair of dice
  • 3. Determine which player you want to be:

a) Player 1 wins if the highest roll is a 1-2-3-4 (ex: If 2 – 4 is rolled, Player 1 wins) b) Player 2 wins if the highest roll is a 5 or 6 (ex: If 2 – 5 is rolled, Player 2 wins)

  • 4. Play the game 36 times (take turns rolling), and each time record the roll

(ex: 1 – 3, Player 1 wins)

  • 5. Come to the board and write down the number of wins for Player 1 and number of wins for

Player 2 Total Number of Wins for Player 1: __________ Total Number of Wins for Player 2: __________ Result of Roll Winner (P1 or P2) 1. 2. 3. 4. 5. 6. 7. 8. 9. 10. 11. 12. 13. 14. 15. 16. 17. 18. Result of Roll Winner (P1 or P2) 19. 20. 21. 22. 23. 24. 25. 26. 27. 28. 29. 30. 31. 32. 33. 34. 35. 36.

slide-9
SLIDE 9
slide-10
SLIDE 10

Conditional Probability Preferences Activity (PPT)

slide-11
SLIDE 11

Probability Review Bingo PPT (4x4 Bingo Square)

slide-12
SLIDE 12

Expected Value Activity

The Rules

Player 1 will choose a chip without looking, while Player 2 records the result. Player 1 will replace the chip, shake the bag, and choose again. Do this a total of 20 times. Player 2 and Player 1 will switch. Record the combined total for both Player 1 and Player 2.

  • If you draw a blue chip, you will lose $1
  • If you draw an orange chip, you will break even
  • If you draw a red chip you will gain $1
  • If you draw a purple chip you will gain $2

Expected Value: Calculate the expected value Results Player 1 + Player 2 Total: ______ P1 Result 1 2 3 4 5 6 7 8 9 10 11 12 13 14 15 16 17 18 19 20 Player 1 Total: _____ P2 Result 1 2 3 4 5 6 7 8 9 10 11 12 13 14 15 16 17 18 19 20 Player 2 Total: _____

slide-13
SLIDE 13

Binomial Probability Activity

Each bag has 15 red (or yellow) chips, 5 clear chips, 3 green chips, and 2 blue chips. If you were to choose five random chips (without replacement) and record the results, would that meet the requirements of a binomial experiment? If not, how can we modify the experiment?

The Experiment:

  • Find a partner. One student will draw chips, the other will record (feel free to switch at any point)
  • Shake the bag, and choose 5 chips (without looking, of course).
  • Record each trial as a success (drawing a red/yellow) or a failure (drawing any other color)
  • Replace the chips, shake the bag, and repeat the experiment a total of 10 times.
  • Count the number of times there were 3 or more successes, and write the total on the board.

Results How many times were there three or more successes? _______ Write this result on the board. Calculate the theoretical probability: n = _____ p = ______ P( ) Trial 1 (S/F) Trial 2 (S/F) Trial 3 (S/F) Trial 4 (S/F) Trial 5 (S/F) 1 2 3 4 5 6 7 8 9 10

slide-14
SLIDE 14

Intro to Hypothesis Testing: Coin Activity

slide-15
SLIDE 15

Significance Level Card Trick