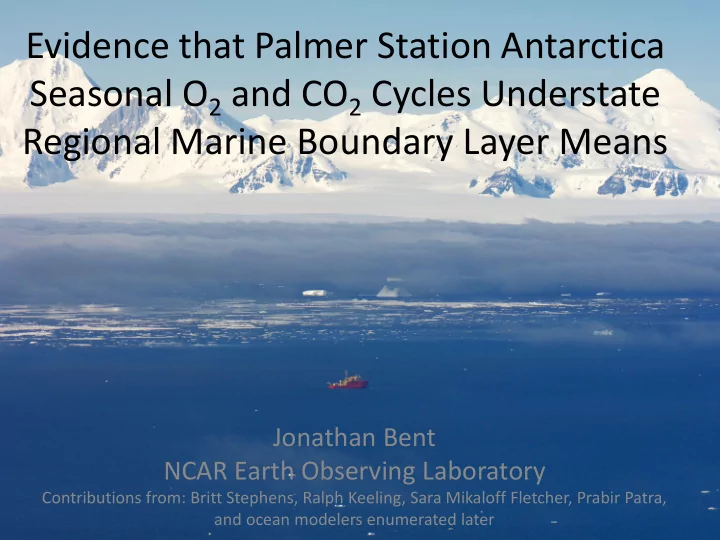

Evidence that Palmer Station Antarctica Seasonal O 2 and CO 2 Cycles Understate Regional Marine Boundary Layer Means Jonathan Bent NCAR Earth Observing Laboratory Contributions from: Britt Stephens, Ralph Keeling, Sara Mikaloff Fletcher, Prabir Patra, and ocean modelers enumerated later
Atmospheric Potential Oxygen • APO ≈ O 2 + 1.1 * CO 2 • Effectively removes land biosphere influence on C cycle • Reinforcing signals in O 2 especially useful in open-ocean Southern Hemisphere regions • Reported in “per meg”, equivalent to per mil, but multiplied by 10 6 • 1 ppm is ~ 5 per meg
Potential evidence that PSA measurements are not capturing seasonal amplitude Nevison, 2016 GRL 1.
Gould O2 Data
How Palmer Compares against other latitudes Figure: B. Stephens
Spheres of wind influence
Why does it matter if air is coming from E or W? Topography
HYSPLIT back trajectories ORCAS RF01 ORCAS RF06
Gould O2 Data Figure: B. Stephens
SO Seasonal Atmospheric Vertical Mixing PSA PSA PSA Figures: B. Stephens
Future steps with PSA • Comparisons of CESM output at source regions for Gould and flask data • STILT simulations for Influence Functions • Determining how to adjust methods or measurements to make models and data comparable
Acknowledgements • Britt Stephens and Ralph Keeling (co-advisors, collaborators) • Sara Mikaloff Fletcher (NIWA) for TM3 runs • Prabir Patra (JAMSTEC) for ACTM runs • Keith Rodgers, Olivier Aumont, Matt Long, Corinne LeQuere, Scott Doney, John Donne for Ocean Model Output
Recommend
More recommend