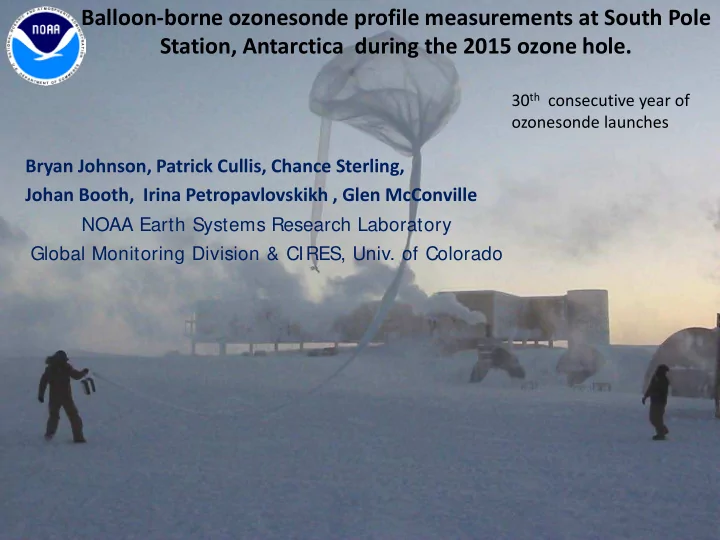

Balloon-borne ozonesonde profile measurements at South Pole Station, Antarctica during the 2015 ozone hole. 30 th consecutive year of ozonesonde launches Bryan Johnson, Patrick Cullis, Chance Sterling, Johan Booth, Irina Petropavlovskikh , Glen McConville NOAA Earth Systems Research Laboratory Global Monitoring Division & CIRES, Univ. of Colorado
South Pole ozonesondes 2015: 3 profiles representing depletion. Weekly ozonesondes 45-65 balloon launches per year since 1986 Tracking the yearly ozone hole : 1. Minimum Total Column - Oct 15 112 Dobson Units. 2. Compare with Dobson Spectrophotometer & Satellite Total column. 3. How fast ozone drops within 14-21 km Layer during September (average). 4. Unusual events – 2015 was longest period before ozone hole vortex break up.
Ozonesonde Total Column (Dobson Units) Weekly ozonesondes
South Pole Total Column in 2015 – and ozone recovery profile Sunset Sunrise Two big advanges of ozonesondes 1. Measurements when dark. 2. High resolution profiles allow analyzing altitude intervals where most depletion occurs: 14-21 km layer at South Pole.
Minimum Total Column: 15 th lowest minimum in 30 year record. Weekly ozonesondes
COMPARE : with Dobson Spectrophotometer total column ozone. Plot & data from Koji Miyagawa (visiting scientist), Bob Evans, Glen McConville DOBSON SPECTROPHOTOMETER Dobson Spectrophotometer at South Pole. OZONESONDE % Difference in Total Column (Dobson – Sonde)/Dobson = -2 ± 5 %
COMPARE : OMI + MERRA satellite total column ozone. S. Hemisphere min ozone: NASA OZONE WATCH OMI SATELLITE Aug 15 Sep 18 Antarctic ozone hole threshold < 220 DU total column Oct 15 Dec 18 OZONESONDE % Difference in Total Column (OMI – Sonde)/OMI = - 1 ± 5 %
14 – 21 kilometers: September depletion rate Slope = 3.2 DU/DAY July - October Altitude Ambient Pressure 14 km ~ 108 hPa 21 km ~ 30 hPa
Region above ozone depletion range (> 22km) shows no change until Dec 16
When to Expect first signs of recovery in the Antarctic ozone hole. Depends on relationship between ozone loss rate and Equivalent Effective Stratospheric Chlorine 1986 South Pole ozonesondes begin The NOAA Ozone Depleting Gas Index: Guiding Recovery of the Ozone Layer http://www.esrl.noaa.gov/gmd/odgi/ NOAA/ESRL/GMD Stephen Montzka, Geoff Dutton & James Butler
One sign of improvement when comparing to similar vortex in 2006. 2006 : Record Antarctic Ozone Depletion Year. South Pole minimum Total Column = 92 DU 14-21KM = 1.2 DU
E lectrochemical C oncentration C ell ozonesonde
Thank you to the South Pole South Pole Observatory Personnel: Winter Over and Summer Crew Observatory winter over & summer crews and NSF (helium). Summary: Total Column Min: 112 DU = 15 th lowest/ 30 years • 14 – 21 km Min: 5 DU = 14 th lowest/ 30 years • 14 – 21 km September loss rate = 3.2 DU/Day (avg) • • Ozone hole / vortex stable until mid December. • State of the Climate 2015 Report & WMO Antarctic Bulletin: The 2015 Antarctic ozone hole was amongst the largest in areal coverage and most persistent due to unusually weak stratospheric wave dynamics, resulting in a colder and stronger than normal stratospheric polar vortex. • Complete Summary all measurements http://www.wmo.int/pages/prog/arep/WMOAntar cticOzoneBulletins2015.html
Total Column Min 14 – 21 km layer min
Recommend
More recommend