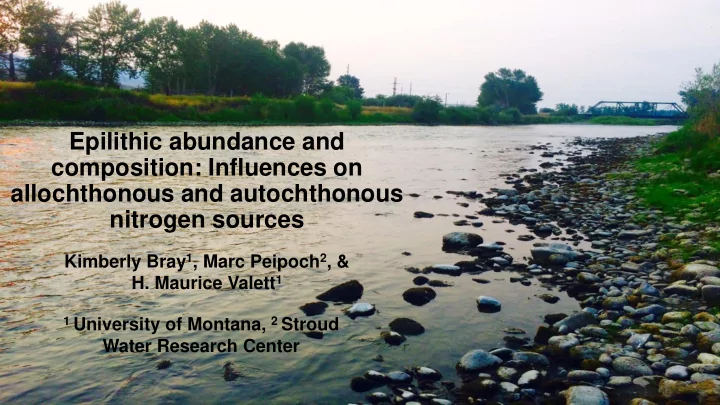

Epilithic abundance and composition: Influences on allochthonous and autochthonous nitrogen sources Kimberly Bray 1 , Marc Peipoch 2 , & H. Maurice Valett 1 1 University of Montana, 2 Stroud Water Research Center
Peterson et al. 2001, Science
N 2 Allochthonous - NO 3 N fixation nitrate uptake Autochthonous N org - NO 3 Biota
Clark Fork River Source: Clark Fork Coalition
Nutrient Concentrations Nitrate Phosphate Discharge From Tri-State Water Quality Council 2009
Redfield Ratio Ratio of C:N:P in oceanic phytoplankton = 106:16:1 Alfred Redfield Source: NOAA
Nutrient Concentrations Nitrate SRP Redfield Ratio
Epilithic OM and chlorophyll a Chl a AFDM Cladophora algae
Seasonal Cladophora bloom: A conceptual diagram discharge Cladophora
Nostoc cyanobacteria: a blue- green “algae” - NO 3 - NO 3
Nostoc cyanobacteria stream conditions: • High levels of PAR • Slow moving water • High phosphate concentrations • Low nitrate concentrations • High temperatures Facultative Nitrogen Fixation nitrogenase N N + 8 H + + 8 e - 2 NH 3 + H 2
Seasonal succession of periphyton: A conceptual diagram discharge Nostoc Cladophora
Seasonal succession of periphyton: A conceptual diagram Autochthonous N Allochthonous N discharge Nostoc Cladophora
Key questions: • What is the role of allochthonous and autochthonous nitrogen sources in determining epilithic biomass over a summer growing season? • How do environmental conditions influence N fixation rates? Source: Clark Fork Coalition
Drummond, MT Study Sites Diel Study Site University of Montana Missoula Summer-long Study Site
Sampling Timeline July Aug. Aug. Sept. Aug. 31 st 9 th 14 th 8 th 28 th Seasonal sampling: 9 replicates per round Metrics • N fixation rates Diel sampling: 3 replicates every 2.5 hours • Instream nutrient concentrations (ammonium, nitrate, phosphate) • Dissolved oxygen concentrations • Temperature • PAR • Epilithic composition and abundance • Chlorophyll a
Acetylene Reduction Technique nitrogenase H C C H + 2H + + 2 e - H 2 C = C H 2
Cell Counts Green algae Cyanobacteria
Seasonal N fixation
Seasonal N fixation and nutrient concentrations Concentration (µg N or P/L) Nitrate Ammonium Phosphate Highest [NO 3 - ] + ] & [NH 4 - ] Lowest [NO 3 + ] & [NH 4
40 (g AFDM / m 2 ) Epilithic OM 30 AFDM (g / m2) Seasonal trends in 20 epilithic biomass and periphyton composition 10 0 Date 1800 1600 Cell Abundance (# / field of view) 1400 1200 1000 Y Data 800 Nostoc 600 400 Clado. 200 0 Date
Diel N fixation Night 0.19 ± 0.13 0.03 ± 0.006
Environmental influences on diel N-fixation R 2 = 0.36 R 2 = 0.36 N fixation (µg N/m 2 /hr) N fixation (µg N/m 2 /hr) p = 0.019 p = 0.027 0.4 0.4 0.2 0.2 0 0 600 200 400 15 20 25 30 35 PAR (mmol m -2 S -1 ) Temperature ( ° C)
Metabolic Demand: Temperature dependence of N fixation Arrhenius Relationship: ln N fixation = −E a kT + ln A Activation energy = 1.34 eV From Welter et al. 2015 Temperature (1/kT)
Conclusions Environmental Constraints: • Temperature • PAR • Nutrient concentrations • Epilithic composition from Grimm and Petrone 1997
Source: NY State Department of Environmental Conservation
Source: Clark Fork Coalition
Acknowledgements • Maury Valett • Marc Peipoch • Amy Marcarelli • Erin Eberhard • Patrick Hurley • Carly Andlauer "This material is based upon work supported in part by the National Science Foundation EPSCoR Cooperative Agreement OIA-1757351"
Recommend
More recommend