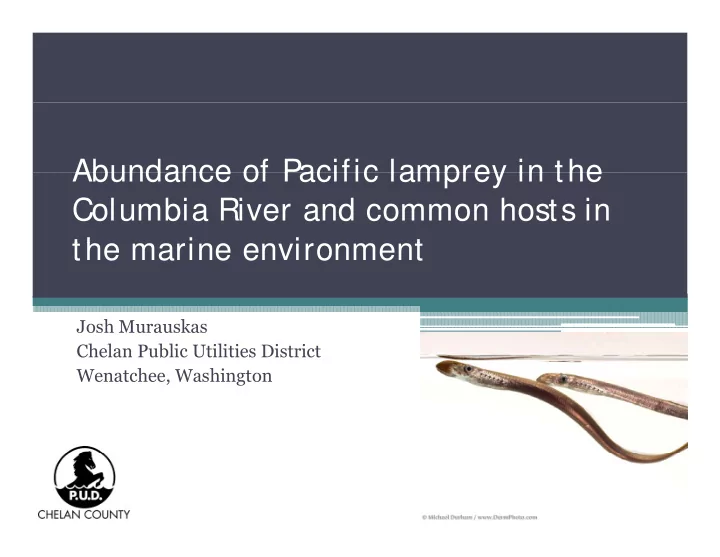

Abundance of Pacific lamprey in the Abundance of Pacific lamprey in the Columbia River and common hosts in the marine environment the marine environment Josh Murauskas Chelan Public Utilities District Wenatchee, Washington , g
Overview • Pacific lamprey life history • Trends in the Columbia River • Relationships with marine fishes R l ti hi ith i fi h • Discussion on ecology USFWS
Lamprey life cycle p y y Reproductive p Migration Parasitic Stage Spawning Adults Seaward Juveniles Larval Stage Migration Transformation
Feeding of adult lampreys g p y • River lampreys • Sea lampreys • Pacific lampreys P ifi l
NOAA NOAA
Columbia River Basin • Largest in Pacific NW • Hydroelectric projects • Upstream access to Chief Up C Joseph Dam (rkm 877) • Significant runs of Significant runs of anadromous fishes
Trends in the Columbia River 400 160 1942 to 1952 am preys 140 350 1997 to 2007 120 f lampreys s 100 100 Thousands of la 300 80 60 40 250 20 ousands of 0 0 200 1 2 3 4 5 6 7 8 9 10 11 Year in in period 150 Tho 100 50 - Year
Trends in the Columbia River
Our study –examine feeding stage y g g • Five host species • Stock assessment data and commercial landings • Lamprey returns to the Columbia River L t t th C l bi Ri • Correlation and regression analyses • Population cycles
140,000 y = 232.82x ‐ 47891 R² = 0.5656 120,000 100,000 eturns 80,000 , Lamprey re 60,000 40,000 20,000 140,000 y = 1.5095x ‐ 86784 R² = 0.8378 0 120,000 0 100 200 300 400 500 600 700 Herring landings g g 100,000 mprey returns 80,000 60,000 La 40,000 20,000 ‐ 50,000 75,000 100,000 125,000 150,000 Pacific herring biomass
140,000 y = 0 5433x ‐ 33683 y 0.5433x 33683 R² = 0.5634 120,000 100,000 returns 80,000 Lamprey r 60,000 40,000 20 000 20,000 y = 36262x ‐ 33581 140,000 0 R² = 0.7288 0 50,000 100,000 150,000 200,000 250,000 120,000 Hake landings 100,000 mprey returns 80,000 60,000 Lam 40,000 20,000 ‐ 0.00 1.00 2.00 3.00 4.00 5.00 Age 3+ hake biomass
140,000 y = 56.306x + 4874.1 R² = 0.5581 R² 0 5581 120,000 100,000 eturns 80,000 , Lamprey re 60,000 40,000 20,000 140,000 y = 13664x ‐ 6452.8 0 R² = 0.9606 120,000 0 200 400 600 800 1,000 1,200 1,400 1,600 Pacific cod landings Pacific cod landings 100,000 prey returns 80,000 60,000 60 000 Lamp 40,000 20,000 ‐ 0.0 2.0 4.0 6.0 8.0 10.0 Pacific cod CPUE
68% d 68% decrease 65% decrease
Species Index p-value r Pacific Hake Biomass Age 3+ (mmt) < 0.001 0.854 Walleye Pollock Biomass (mmt) 0.002 0.857 Pacific Cod CPUE (kg ha -1 ) < 0.001 0.981 Chinook Salmon Peak counts (adults mi -1 ) < 0.001 0.882 Pacific Herring Biomass (mt) 0.001 0.915 Pacific Hake * Landings WA + OR (mt) 0.005 0.751 Walleye Pollock ** Landings WA + OR (mt) 0.059 0.737 Pacific Cod Landings WA + OR (mt) 0.002 0.747 Chinook Salmon Landings WA + OR (mt) 0.005 0.699 Pacific Herring Landings WA + OR (mt) 0.002 0.752 * Time lag of +2 years, ** time lag of -1 year
Time lags… g 140,000 4000 3500 120,000 120,000 s y returns landings 3000 100,000 2500 80,000 2000 2000 Lam prey Pollock l 60,000 1500 40,000 1000 L 20,000 500 0 0 Lamprey Pollock Year
Population cycles (Columbia) p y ( ) 1939 1949 1959 1969 1979 1989 1999 2009
Population cycles (North Pacific) p y ( ) 1975 1980 1985 1990 1995 2000 2005
Discussion • Criticisms • Host selectivity ▫ Data, correlation & causation l ▫ With growth? h h • Underlying mechanisms • Oceanic movements ▫ PDO, PNI? O ? ▫ With hosts i h h • Other species • Population cycles ▫ Rockfish, salmon, flatfishes R kfi h l fl fi h ▫ Life cycle of lampreys Lif l f l ▫ Predators? • Importance of marine survival ▫ 10 00% vs 0 02% ▫ 10.00% vs. 0.02%
Population model p * Concept from Lawson 1993
Acknowledgments g • A. Orlov (VNIRO) and K. Siwicke (UAF) • Several helpful reviewers • TINRO-Center, Pacific Halibut Commission, TINRO C t P ifi H lib t C i i NMFS
Recommend
More recommend