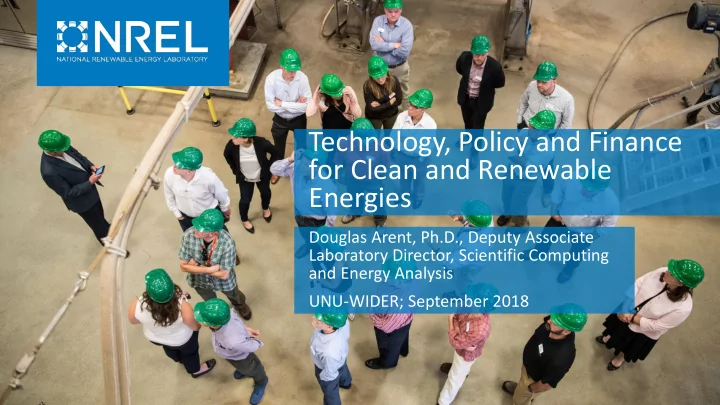

Technology, Policy and Finance for Clean and Renewable Energies Douglas Arent, Ph.D., Deputy Associate Laboratory Director, Scientific Computing and Energy Analysis UNU-WIDER; September 2018
NREL at a Glance nearly $872M 1,800 750 National economic impact \ National economic impact annually Employees, National World-class Partnerships Campus plus more than economic facilities, renowned with industry, operates as a 400 technology experts academia, and living laboratory impact government early-career researchers and visiting scientists NREL advances the science and engineering of energy efficiency , sustainable transportation , and renewable power technologies and provides the knowledge to integrate and optimize energy systems .. NREL | 2
MEGA TRENDS Global Trends in Digitization, Decentralization, Decarbonization
World Energy Consumption Rises 28% between 2015 and 2040 World Energy Consumption 800 2015 600 Non-OECD Quadrillion Btu 400 200 OECD 0 1990 2000 2010 2015 2020 2030 2040 NREL | 4
Electrification Will Dominate Energy Growth International Energy Outlook 2017 NREL | 5
Renewables Dominate Power Capacity Growth NREL | 6
Global Renewable Power Capacity
High Shares of Variable Renewable Power on the Grid
Global Investment in Renewable Energy ➜ Global new investment in renewable power and fuels in 2017: USD 279.8 billion (+2.2%) (USD 319.8 billion incl. large hydropower) ➜ Investment in new renewable power capacity roughly three times that in new fossil fuel capacity ➜ Renewable energy: 68% of the total amount committed to new power-generating capacity in 2017 ➜ USD 310 billion (est.) committed to constructing new renewable power plants, compared to: • Fossil fuel-fired generating capacity: USD 103 billion • Nuclear power capacity: USD 42 billion
Costs and Performance of PV exemplifies decadal advancements IRENA, 2016; PV Auction Prices NREL | 10
Potential of Wind: More Generation as Turbines Grow NATIONAL RENEWABLE ENERGY LABORATORY 11
Wind Energy Potential Capacity at 80m Hub Height 2008 Turbine Technology NATIONAL RENEWABLE ENERGY LABORATORY 12
Wind Energy Potential Capacity at 110m Hub Height 2014 Turbine Technology NATIONAL RENEWABLE ENERGY LABORATORY 13
Wind Energy Potential Capacity at 140m Hub Height ‘Near Future’ Turbine Technology (150W/m 2 ) NATIONAL RENEWABLE ENERGY LABORATORY 14
Wind and Solar Add Variability to Supply Side Wind and solar add variability and uncertainty to the generation supply, increasing the need for grid flexibility. NATIONAL RENEWABLE ENERGY LABORATORY 15
Electricity Modeling at Multiple Scales wind, solar, Global Global energy-economic-climate demand, generator, transmission Rooftop PV adoption U.S. Geographic Scale Security-constrained unit National policy, market, commitment & economic dispatch technology analysis Regional/ Balancing Regional integrated Area Automatic generation resource planning control (AGC) & dispatch Agent Based Models of Customer Behavior Hourly plant output Generator Annual Seasonal/Diurnal Hourly Sub-hourly Temporal Resolution NATIONAL RENEWABLE ENERGY LABORATORY 16
Gaining insights from Advanced Visualization
ERGIS Visualization NATIONAL RENEWABLE ENERGY LABORATORY 18
India’s 2022 100 GW Solar Goal Requires an Evolution in Power System Planning Solar (and wind) generation is variable, uncertain, and location- constrained… …raising new considerations for grid planning and operations 1. More flexibility is needed to balance supply and demand 2. More transmission might be necessary 3. Grid services (e.g. inertial response) from wind/solar or other equipment come at additional cost 4. Existing conventional generators are needed, but run less, affecting cost recovery NREL | 19
India’s power system with 160 GW wind and solar — Achieving system balance every 15 minutes http://www.nrel.gov/india-grid-integration NREL | 20
The Evolving Power System Transitioning today: Restructuring, New Business Models, New Technologies NREL | 21
A Few Takeaways • Technology advances are changing the landscape • IT & ET & Business model Innovations… • Renewables offer domestic advantages with potential economy wide benefits: • Price certainty, trade, water/food, health… • Policy, Finance/business models enable or hinder change • Power Sector Structural reforms underway across the globe • Innovation in Financing and Financial reforms continue to evolve to support creative business solutions NREL | 22
Human-Centered Innovation It is not the essential nature of a technology that matters but its capacity to fit into the social, political, and economic conditions of the day. –The Economist, March 12, 2012 “The Dream that Failed” NREL | 23
References and Resources www.nrel.gov www.21stcenturypower.org www.cleanenergysolutions.org NATIONAL RENEWABLE ENERGY LABORATORY 24
Recommend
More recommend