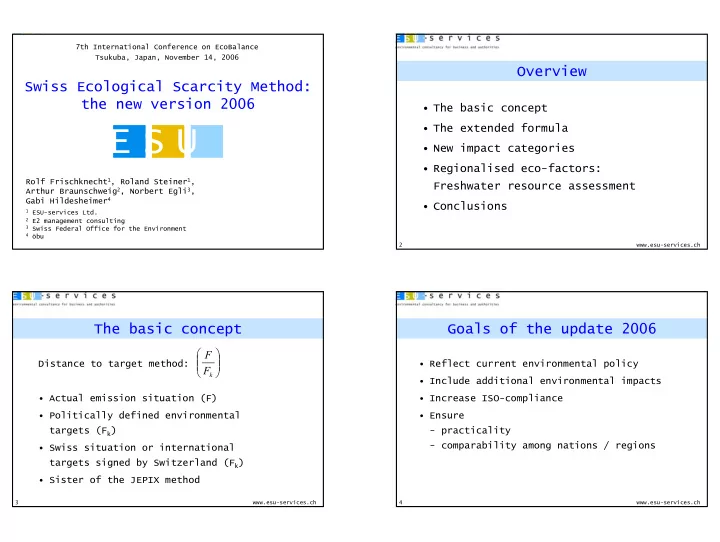

7th International Conference on EcoBalance Tsukuba, Japan, November 14, 2006 Overview Swiss Ecological Scarcity Method: the new version 2006 • The basic concept • The extended formula E E U U S S • New impact categories • Regionalised eco-factors: Rolf Frischknecht 1 , Roland Steiner 1 , Freshwater resource assessment Arthur Braunschweig 2 , Norbert Egli 3 , Gabi Hildesheimer 4 • Conclusions 1 ESU-services Ltd. 2 E2 management consulting 3 Swiss Federal Office for the Environment 4 öbu 2 www.esu-services.ch The basic concept Goals of the update 2006 F Distance to target method: • Reflect current environmental policy F k • Include additional environmental impacts • Actual emission situation (F) • Increase ISO-compliance • Politically defined environmental • Ensure targets (F k ) - practicality - comparability among nations / regions • Swiss situation or international targets signed by Switzerland (F k ) • Sister of the JEPIX method 3 www.esu-services.ch 4 www.esu-services.ch
The extended formula Features of extended formula 1 EP F = ⋅ ⋅ eco - factor c ( 1 ) • Characterisation made explicit F F k k • Normalisation flow based on actual flows 2 1 F (not critical flows) = ⋅ ⋅ ⋅ ⋅ 1 EP K c ( 2 ) { { F F • Normalisation flow independent of flows Characteri sation k Constant { 1 2 3 (optional) (1e12 UBP/a) used in weighting factor Normalisat ion Weighting => enables regionalisation EP : eco - point (the unit) • identical eco-factors with new and with F : current flow existing formula in basic cases (national F : critical flow averages) k 5 www.esu-services.ch 6 www.esu-services.ch Meaning and purpose of the factors New environmental impacts • Normalisation: Resources: - quantifies Swiss annual contribution to • Use of Freshwater the environmental problem • Land occupation - relates the scale of the environmental problem to the Swiss scale Emissions to water: • Weighting: expresses the scarcity of the • Endocrine disruptors environmental impact in Switzerland or any • Radionuclide emissions to the Sea other region 7 www.esu-services.ch 8 www.esu-services.ch
General Layout Freshwater use Result Weighting Characterisation Inventory Crude oil Primary energy • Freshwater is getting increasingly scarce in more and Uranium Wood more world regions Biodiversity Land occupation • Large regional and local differences in scarcity Climate change Fresh water Carbon dioxide (CO 2 ) • Need for regionalised eco-factors Swiss Ozone depletion HCFC eco • Scarcity to be defined in relative terms environmental SO 2 points Acidification NMVOC legal targets • Water pressure index: I-129 water consumption / renewable water resources Cancer and hereditary e. N total • References Endocrine disruptors Estrogene potential Heavy metals - Concept: OECD 2004: Key environmental indicators Pesticides Effectiveness - Data: FAO 2005: Aquastat database Hazardous waste Nuclear waste 9 www.esu-services.ch 10 www.esu-services.ch Normalisation / Characterisation Weighting 2 current flow in Region A = Weight (Region A) ( 3 ) • Method applied on Swiss situation critical flow for Region A • Freshwater use in Switzerland: 2 water consumptio n (Region A) = ( 4 ) 2.57 km 3 per year renew. water resource (Reg. A)· 20% (= normalisation flow) • Critical flow = medium water pressure • No characterisation applied • Medium water pressure: consumpion = 20% of renewable water resources 11 www.esu-services.ch 12 www.esu-services.ch
Regional water pressure Classification of countries Water weighting Countries Category water pressure actual water weighting pressure factor range pressure factor category low 0.0625 Argentina, Madagascar, Russia, Switzerland low <0.1 0.05 0.0625 moderate 0.563 moderate 0.1 to <0.2 0.15 0.563 France, Greece, Mexico, USA medium 2.25 Japan, Thailand, China, Germany, Spain medium 0.2 to <0.4 0.3 2.25 high 6.25 high 0.4 to <0.6 0.5 6.25 Algeria, Morocco, Sudan, Tunesia very high 16.0 very high 0.6 to <1.0 0.8 16.0 Pakistan, Syria, Tadschikistan, Turkmenistan ≥ 1 extreme 56.3 extreme 1.5 56.3 Israel, Jemen, Kuwait, Saudi-Arabia 13 www.esu-services.ch 14 www.esu-services.ch Example 1: agricultural products Example 2: material supply 100% 100% 90% 90% grown in applying 80% 80% 70% - Switzerland 70% - low 60% 60% 50% - Spain - medium 50% 40% 40% weighting 30% 30% 20% 20% factor 10% 10% 0% 0% Switzerland Switzerland irrigated Irrigation in Irrigation in irrigated Irrigation in Irrigation in weighting weighting weighting weighting weighting weighting Non- Non- factor for factor for factor for factor for factor for factor for medium medium medium Spain Spain water water water water water water low low low Chromium steel Glued laminated Recycling paper Asparagus Tomatoes timber Emission into Air Emission into Water Emission into Groundwater Emission into Soil Emission into Air Emission into Water Resources (except water) Land Use Emission into Groundwater Emission into Soil Waste (incl. radioactive) Freshwater Resources Resources (except water) Land Use Waste (incl. radioactive) Freshwater Resources 15 www.esu-services.ch 16 www.esu-services.ch
Conclusions • Eco-scarcity formula slightly revised • Regional eco-factors are now possible => method is transferable to other regions • Freshwater use, Land occupation, emissions of endocrine disruptors and radionuclides to the Sea are now included in the assessment • Freshwater consumption gets relevant in agricultural production in regions with medium and higher water pressure • Eco-factors available in EcoSpold format 17 www.esu-services.ch
Recommend
More recommend