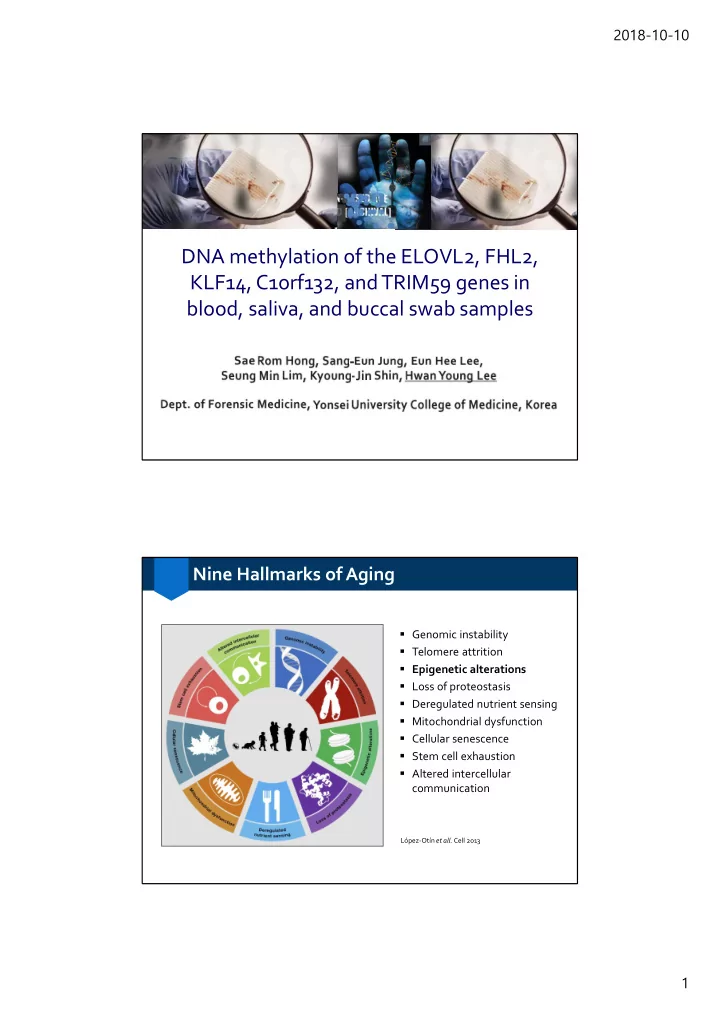

2018-10-10 DNA methylation of the ELOVL2, FHL2, KLF14, C1orf132, and TRIM59 genes in blood, saliva, and buccal swab samples Nine Hallmarks of Aging § Genomic instability § Telomere attrition § Epigenetic alterations § Loss of proteostasis § Deregulated nutrient sensing § Mitochondrial dysfunction § Cellular senescence § Stem cell exhaustion § Altered intercellular communication López-Otín et all. Cell 2013 1
2018-10-10 DNA Methylation Variation Blood Blood (Adult) (Infant) Unsupervised clustering of average beta values in normal human tissues. Christensen et al. PLoSGenet (2009) Age Prediction Based on DNA Methylation Met Met GGACAGGGGCGTGGCGCCTGCT 71 CpGs Age = a + b × CpG 1 + c × CpG 2 + d × CpG 3 + … Training set Test set Hannum et al. MolCell (2013) 2
2018-10-10 Multi-tissue Age Predictor § Horvath’s model: 393 CpGs, less than 4 year error Horvath, Genome Biol (2013) Tissue-specific Age Predictors Sample Model Genes No. CpGs Error (y) Platform Pyro- Weidner et al. ITGA2B, ASPA, PDE4C 3 4.3 sequencing Zbieć- Pyro- ELOVL2 2 5.0 Piekarska et al. sequencing Blood Zbieć- Pyro- ELOVL2 , FHL2, KLF14, C1orf132, TRIM59 5 3.9 Piekarska et al. sequencing Pyro- ELOVL2 , ZNF423, CCDC102B Park et al . 3 3.4 sequencing Bocklandt et al . EDARADD, TOM1L1, NPTX2 3 5.2 27k array Saliva SST, CNGA3, KLF14, TSSK6, TBR1, Hong et al. 7 3.1 SNaPshot SLC12A5, PTPN7 Semen Lee et al. TTC7B, NOX4, unknown 3 5.4 SNaPshot Blood, Pyro- Bekaert et al . ASPA, PED4C, ELOVL2 , EDARADD 4 4.9 teeth sequencing Teeth Giuliani et al. ELOVL2 , FHL2, PENK 5-13 1.2-7.1 EpiTyper 3
2018-10-10 Independent Validation of Blood Models § Zbieć-Piekarska’s model: ELOVL2, FHL2, KLF14, C1orf132, TRIM59 § Analysis platform: Pyrosequencing 300 Polish 100 Koreans Spearman’s rho = 0.972 MAD = 3.90 Cho S et al., Forensic Sci Int Genet (2017) Independent Validation of Blood Models § Another model with 5 CpGs explaining the highest% of age variance in each gene Gene Target (GRCh37) Coefficient Intercept -10.403 ELOVL2 6:11044861 0.612 FHL2 2:106015739 0.465 KLF14 7:130419116 0.330 C1orf132 1:207997026 -0.168 TRIM59 3:160167977 0.408 Cho S et al., Forensic Sci Int Genet (2017) 4
2018-10-10 Change in Analysis Platform § Multiplex methylation SNaPshot for age prediction in blood Blue: methylation Yellow: methylation Green: non-methylation Red: non-methylation FHL2 KLF14 C1orf132 TRIM59 ELOVL2 20s 30s 40s 50s 60s Change in Analysis Platform FORWARD REVERSE G T A C G intensity C intensity %methyl = × 100 %methyl = × 100 (G+A) intensity (C+T) intensity 100 20 DNA methylation difference (%) Estimated DNA methylation (%) 80 15 60 10 40 1.5-fold high 5 20 1.7-fold high 2-fold high 0 0 0 20 40 60 80 100 0 20 40 60 80 100 Actual DNA methylation (%) Actual DNA methylation (%) 5
2018-10-10 Change in Analysis Platform Pyrosequencing Methylation SNaPshot MAD = 3.38 MAD = 4.37 rho = 0.967 ELOVL2 FHL2 KLF14 C1orf132 TRIM59 Blue: methylation Yellow: methylation Green: non-methylation Red: non-methylation Methylation of Blood, Saliva and Buccal Swab FHL2 KLF14 ELOVL2 R² = 0.6274 (blood) R² = 0.7814 (blood) R² = 0.5031 (saliva) R² = 0.4703 (saliva) R² = 0.4995 (buccal swab) R² = 0.3161 (buccal swab) R² = 0.7789 (blood) R² = 0.7789 (blood) R² = 0.6224 (saliva) R² = 0.5895 (buccal swab) R² = 0.6921 (saliva) R² = 0.5895 (buccal swab) TRIM59 C1orf132 R² = 0.5901 (blood) R² = 0.4818 (saliva) R² = 0.5197 (buccal swab) Blood Saliva R² = 0.5786 (blood) Buccal swab R² = 0.4389 (saliva) R² = 0.2074 (buccal swab) 6
2018-10-10 Age Prediction model Training set (n = 240 ) Test set (n = 60) 80 80 Pearson’s rho = 0.955 Pearson’s rho = 0.948 MAD = 3.38 MAD = 3.54 60 60 Predicted Age (years) Predicted Age (years) Blood 40 40 Saliva buccal swab 20 20 0 0 0 20 40 60 80 0 20 40 60 80 Chronological Age (years) Chronological Age (years) Summary § DNA methylation at 5 CpG sites from the ELOVL2, FHL2, KLF14, C1orf132, and TRIM59 genes was investigated in samples from blood, saliva, and buccal swabs using a multiplex methylation SNaPshot assay. § An age prediction model trained on 240 samples including 80 of each blood, saliva and buccal swab samples exhibited high correlation between predicted and chronological ages with a MAD of 3.38 years. § The model showed a MAD of 3.54 years in a validation set of 60 samples including 20 of each blood, saliva and buccal swab samples. § These results suggest that these age-associated markers are less tissue- specific than others 7
2018-10-10 Acknowledgment Kyoung-Jin Shin Sang-Eun Jung Eun Hee Lee Sae Rom Hong Bomin Kim Mi Hyeon Moon SeungMin Lim Yelim Kwon 8
Recommend
More recommend