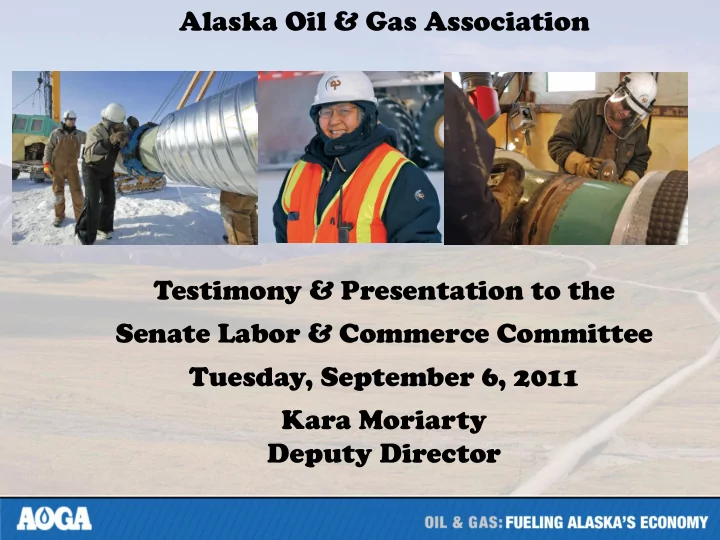

Alaska Oil & Gas Association Testimony & Presentation to the Senate Labor & Commerce Committee Tuesday, September 6, 2011 Kara Moriarty Deputy Director
AOGA Member r Comp mpanie ies
Alaska a Oil & Gas In Industry ry Wo Workfor orce ce Residency ency 2001 - 2009 2009 Alaska Nonresident Nonresident Year Resident Total Percent of Employment Employment Total 2001 10,480 4,068 14,548 28% 2002 9,315 3,200 12,515 26 2003 8,056 2,914 10,970 27 2004 8,126 3,167 11,293 28 2005 8,186 3,442 11,628 30 2006 10,102 4,495 14,597 31 2007 10,941 4,531 15,472 29 2008 11,887 5,043 16,930 30 2009 11,841 4,627 16,468 28 Source: Alaska Department of Labor & Workforce Development (ADOLWD) Includes: Oil and Gas Extraction & Support Services Combined Excludes: Refineries & Pipeline
Alaska a Oil & Gas In Industry ry Wo Workfor orce ce Residency ency 2001 - 2009 2009 Total Oil & Gas Employment Resident Employment Nonresident Employment 18000 16000 14000 12000 10000 8000 6000 4000 2000 0 Source: Alaska Department of Labor & Workforce Development (ADOLWD) Includes: Oil and Gas Extraction & Support Services Combined Excludes: Refineries & Pipeline
Alaska a Residen ents ts Employed ed wi with Oi Oil & Ga Gas In Industry y Related ed Vend ndor ors, s, 2009 Resident Nonresident Resident Nonresident Nonresident Nonresident Industry Wages Wages Workers Workers % of Total % of Total ($millions) ($millions) Construction 1,032 576 35.8% $38.3 $14.2 27.0% 3,217 578 15.2 $200.3 $29.6 12.9 Transportation & Warehousing Professional, 1,085 213 16.4 $72.4 $13.1 15.3 Scientific & Tech. Services 3,977 633 13.7 $127.5 $22.7 15.1 Admin. Support* All Others 6,275 542 8.0 $283.0 $15.6 5.2 Total 15,586 2,542 14.0% $721.5 $95.2 11.7% Source: ADOLWD * Full sector title is Administration Support/Waste Management and Remediation.
Alaska a No Nonr nreside dent nt Hire Rates 2009 2009 75% 50% 41% 29% 28% 22% 20% 18% 10% 7% Source: ADOLWD
2009 Ann nnual l Average e No Non-Reside ident nt & 2010 Th Third Quarter r On Only y Ne New w Hire Rates 90% 80% 70% 60% 50% 40% 30% 20% 10% 0% Manufacturing Accommodations Metal Mining Oil & Gas Construction Prof., Scientific, Health Care & State and Technical Social Assistance Government Services Source: ADOLWD – 2011 April Alaska Economic Trends Blue: 2009 Yearly Average Green: 2010 Third Quarter New Hire Only Note: Manufacturing predominately Seafood Processing.
Pr Prod oduct uction ion Con ontinue nues s to De o Decline ne 1.2 1 0.8 0.6 0.4 0.2 0 2000 2002 2004 2006 2008 2010 2012 2014 2016 2018 2020 Currently Producing Under Development Under Evaluation Source: Department of Revenue
Com ommo mon n Goa oal: Mor ore Job obs for or Future e Gene nerati ations ons
Recommend
More recommend