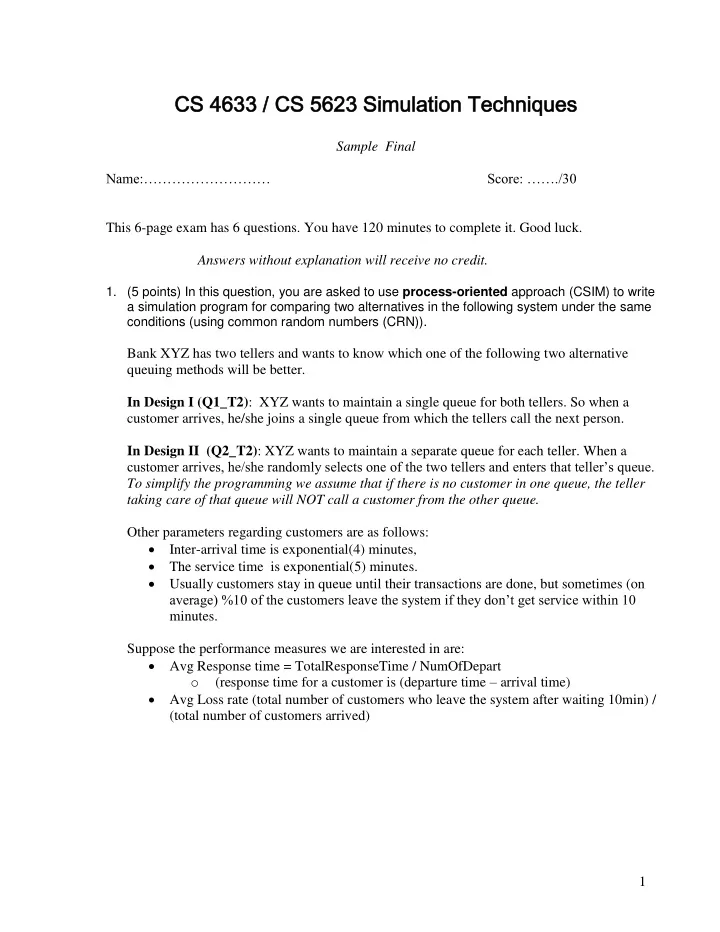

CS 46 S 4633 33 / / CS 5 CS 5623 23 Sim Simulatio ulation Te n Tech chni niques ues Sample Final Name:……………………… Score: ……./30 This 6-page exam has 6 questions. You have 120 minutes to complete it. Good luck. Answers without explanation will receive no credit. 1. (5 points) In this question, you are asked to use process-oriented approach (CSIM) to write a simulation program for comparing two alternatives in the following system under the same conditions (using common random numbers (CRN)). Bank XYZ has two tellers and wants to know which one of the following two alternative queuing methods will be better. In Design I (Q1_T2) : XYZ wants to maintain a single queue for both tellers. So when a customer arrives, he/she joins a single queue from which the tellers call the next person. In Design II (Q2_T2) : XYZ wants to maintain a separate queue for each teller. When a customer arrives, he/she randomly selects one of the two tellers and enters that teller’s queue. To simplify the programming we assume that if there is no customer in one queue, the teller taking care of that queue will NOT call a customer from the other queue. Other parameters regarding customers are as follows: Inter-arrival time is exponential(4) minutes, The service time is exponential(5) minutes. Usually customers stay in queue until their transactions are done, but sometimes (on average) %10 of the customers leave the system if they don’t get service within 10 minutes. Suppose the performance measures we are interested in are: Avg Response time = TotalResponseTime / NumOfDepart o (response time for a customer is (departure time – arrival time) Avg Loss rate (total number of customers who leave the system after waiting 10min) / (total number of customers arrived) 1
Name:………… 2. (5 points) Suppose we are interested in determining steady state performance of the design I (namely, Q1_T2) in the previous question under some modifications. Specifically, consider the following setting. We have two tellers and a single queue. So when a customer arrives, he/she joins a single queue from which the tellers call the next person. Parameters regarding customers are the same as before, i.e.,: Inter-arrival time is exponential(4) minutes and The service time is exponential(5) minutes. This time, however , we assume that all customers stay in queue until their transactions are done. And the size of the queue is infinite. Given that system, compute the following performance measures analytically: a) Utilization of the tellers (namely, ), b) The average number of the customer in the system (namely, L ) and c) The average time spend in the system (namely, w ) (hint: first identify what kind of queuing system will be the best for the above system! Before using its formulas, find the arrival rate , which is equal to 1/(average inter-arrival time) and service rate , which is equal to 1/(average service time).) 2
Name:………………………….. 3. (5 points) Suppose we are interested in the steady-state (or long-run) performance measure of a system (e.g., number of packets in a router). Accordingly, we developed a simulation model and observed the data points in the below table. Suppose each data point represents the batch means, e.g., average number of packets, within 1-second interval. observations 7 Replication 1 2 3 4 5 6 4.3 1 2.3 2.3 1.5 3.8 3.4 3.3 2.3 2 1.2 2.8 2.3 2.5 3.2 1.8 3.5 3 2.2 1.2 2.2 3.5 3.5 5.2 3.9 4 1.1 1.3 2.0 3.4 5.3 4.5 a. (2pt) Compute ensemble averages and roughly plot them. Which data point(s) should be deleted (briefly explain why you selected these data points)? b. Suppose the deletion in part (a) significantly reduces the initialization bias, i. (1pt) Estimate the steady-state (or long-run) performance measure and j. (2pt) Compute the 95% confidence interval for 3
Name:……………… 4. (5 points) Suppose that we have two alternative systems to compare based on their performance in response time. Assume that we have developed appropriate simulation models and used correlated sampling technique. Accordingly, our simulation models have produced the data shown in the following table. Average response time Replication System 1 System 2 Correlated with system 1 using synchronized CRN 1 11 13 2 14 17 3 11 12 4 11 13 5 13 16 6 12 15 7 14 15 8 12 13 Compare System 1 and System 2 using the correlated sampling method (namely CRN method) with confidence level of 95%. Can you decide which system is better? Why/why not? 4
Name:……….. 5. (5 points) In this question, you are asked to do input modeling for a continues random variable X. Suppose we collected the following data points. 1 12 85 10 4 30 7 13 1 7 30 16 35 1 21 60 6 2 25 15 4 a. (3pt) Determine the family of distribution (In the histogram, bin the elements of data points into 0-10, 11-20, 21- 30,….) b. (2pt) Estimate the parameters of the distribution you chose in (a). (hint: for some distributions you don’t need S 2 ). 5
Name:…………….. 6. (5 points) The pdf of a continuous r.v. X is given by 1 0 x < 2 6 2 2 x 5 f(x) = 9 0 otherwise a. (2pt) Compute the cdf F(x) and draw it. b. (3pt) Develop a procedure using inverse transform technique to generate random variates from the above pdf. 6
Recommend
More recommend