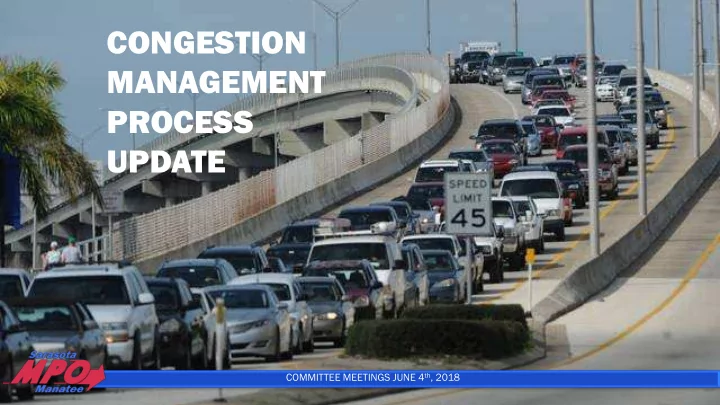

CONGESTION MANAGEMENT PROCESS UPDATE COMMITTEE MEETINGS JUNE 4 th , 2018
Congestion Management Process TASK 1 1. Review of existing goals, objectives, and strategies 2. Identification of existing data sources Public Involvement 3. Prioritized performance measures Technical Advisory Committee Bicycle, Pedestrian, Trails Advisory Committee
Review of Existing Goals Ad Advan ance ced Traf affic c Management System Sy Mast ster P Plan Existi ting g CMP CM Saras asota M a Manat atee M MPO Goals ls & & FHWA Nati tional l Goal als
Review of Available Data Vehicle occupancy rates • • Roadway Characteristic Inventory (RCI) to Traffic Message Channel (TMC) look up Data for developing LOS for bike and • tables pedestrians Accessibility measures from University of • • 2017 HERE speed data Minnesota Shapefiles for developing safety • • 2017 NPMRDS speed data measures Population data, urban area data, crash • • 2017 RCI data and factors data, public road mileage data, state and • Posted speed limit national highway system data • Number of lanes • Area type 2017 Traffic Characteristics Inventory • • Functional classification data and factors Vehicle Volumes • Bike lanes • Vehicle classifications • • Sidewalks Truck Volumes • • Other roadway geometry (e.g. lane Peak hour factors • width and median) Directional factors •
Recommended Performance Measures Ave vera rage T Travel S l Speed Defin init itio ion Average travel speed can be obtained from detector data, vehicle probe data, or through modeling. Travel demand models estimate free flow and congested travel speeds for each individual network link. Average travel speed is a metric easily understood by travelers. Reportin ing Pe Perio iod Speed can be reported for the peak period, off peak, or daily average. Appropriat iate l level f for A Applic icat atio ion This measure could be reported for facilities, corridors, and systemwide. Federal al G Guid idan ance The FHWA planning factor to increase mobility of people and freight can be measured through average travel speed. Person H Hou ours of of Delay Defin init itio ion Vehicle delay is calculated as the product of directional hourly volume and the difference between travel time at a threshold speed and travel time at the observed speed. The resulting vehicle delay is multiplied by a vehicle occupancy factor to arrive at person hours of delay; travel demand models in Florida typically include this calculation. Reportin ing Pe Perio iod Person hours of delay can be reported for the peak period, daily, or annually. Appropriat iate l level f for A Applic icat atio ion This measure could be reported at points, facilities, corridors, and systemwide. Federal al G Guid idan ance The FHWA planning factor to increase mobility of people can be measured through person hours of delay.
Recommended Performance Measures Leve vel o l of Travel T l Time R Reliabili lity ( (LOTTR) Defin init itio ion LOTTR is a metric for measuring the travel time reliability of the system. LOTTR is a ratio of the 80 th percentile travel time to the 50 th percentile travel time for all vehicles. This measure is applied for the NHS separately for Non-Interstates and Interstates. Reportin ing Pe Perio iod Four time periods: AM Peak, Midday, PM Peak, and Weekend Appropriat iate l level f for A Applic icat atio ion The LOTTR measure is calculated for each directional road segment (for example, eastbound is one segment and westbound is another segment). Federal al G Guid idan ance The worst ratio of the 4 time periods represents the roadway section. Above 1.50 in unreliable. The annual person miles on the road are placed into a category of reliable or unreliable. Tru ruck T Tra ravel T Time R Reli liability ( (TTTR) Defin init itio ion TTTR is a metric for measuring truck travel time reliability on the Interstate system. It is a ratio of the 95 th percentile travel time to the 50 th percentile travel time - this measure is applied for the NHS Interstates. Repor orting P Period od Five time periods: AM Peak, Midday, PM Peak, Overnight, and Weekend Appropriate l level f for A Application The TTTR measure is calculated for each directional road segment (for example, eastbound is one segment and westbound is another segment) Fede deral al G Guidan ance The worst ratio of the 5 reporting periods is selected to represent the roadway section. The worst time period TTTR value is multiplied by the segment length.
Travel Time Reliability on the Desoto Bridge
Travel Time Reliability on the Green Bridge
Interstate Reliability Measure
Interstate Reliability Measure % % Pers rson Mi Mile les T Tra raveled t tha hat a are re R Reliable Most Least Adopted Conservative Conservative Target 2-ye year 2-ye year 76.0% 82.0% 75.0% Range 4-ye year 4-ye year 72.5% 78.5% 70.0% • Trend through 2022 is consistent with the past 4-year trend range • Maintain conservative stance given external factors (VMT growth)
Non-Interstate Reliability Measure
Non-Interstate Reliability Measure % % Pers rson Mi Mile les T Tra raveled t tha hat a are re R Reliable Most Least Adopted Conservative Conservative Target Range 4-ye year 4-ye year 70.0% 76.0% 50.0% • Continued VMT growth will challenge changing trend direction • Challenge created by land use and development
Recommend
More recommend