Compar omparativ ive e I/O O Wor orkload kload Char haract - PowerPoint PPT Presentation
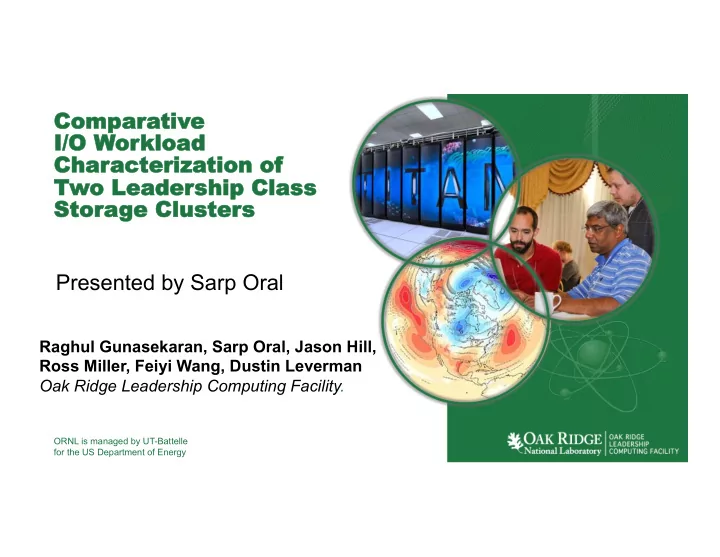
Compar omparativ ive e I/O O Wor orkload kload Char haract acter eriz ization ion of of Two o Leader Leadership hip Clas lass Stor orage ge Clus luster ers Presented by Sarp Oral Raghul Gunasekaran, Sarp Oral, Jason Hill,
Compar omparativ ive e I/O O Wor orkload kload Char haract acter eriz ization ion of of Two o Leader Leadership hip Clas lass Stor orage ge Clus luster ers Presented by Sarp Oral Raghul Gunasekaran, Sarp Oral, Jason Hill, Ross Miller, Feiyi Wang, Dustin Leverman Oak Ridge Leadership Computing Facility. ORNL is managed by UT-Battelle for the US Department of Energy
Oak Ridge Leadership Computing Facility q Design and operate compute and data resources for the most computationally challenging science problems. q Deliver science and transforming discoveries in materials, biology, climate, energy technologies, and basic sciences. q 250+ research organizations, university and industry participants. q Over 500+ active scientific users 2
Oak Ridge Leadership Computing Facility • Compute resources – TITAN, primary compute platform, 18688 compute clients – EOS, CRAY XC30 compute platform, 736 compute node – Rhea, data analysis cluster, 512 node commodity cluster – Everest, visualization cluster • Spider Storage System – 32PB, +1 TB/s - data resource for OLCF computational needs – Lustre parallel file system – Center-wide shared storage resource, for all OLCF resources – Resilient to system failures, both internal to the storage system as well as computational resources 3
OLCF System Architecture XK7 Serial ATA InfiniBand Gemini 3D Torus 6 Gbit/sec 56 Gbit/sec 9.6 Gbytes/sec per direction Titan XK7 Other OLCF resources Enterprise Storage Storage Nodes SION II Network Lustre Router Nodes controllers and large run parallel file system provides connectivity run parallel file system racks of disks are connected software and manage between OLCF client software and via InfiniBand. incoming FS traffic. resources and forward I/O operations primarily carries from HPC clients. 36 DataDirect SFA12K-40 288 Dell storage traffic. controller pairs with servers with 432 XK7 XIO nodes 2 Tbyte NL- SAS drives 64 GB of RAM each 1600 ports, 56 Gbit/sec configured as Lustre and 8 InifiniBand FDR InfiniBand switch routers on Titan connections per pair complex 4 Figure reference: S. Oral, et al. OLCF’s 1 TB/s, next-generation lustre file system. In the proceedings of the Cray User Group Conference, 2013
Spider 2 System Spider Couplet Setup • Deployed 2014 Host port connectors • Max bandwidth:1.4 TB/s read and 1.2 TB/s write (to OSS) • 36 DDN SFA12K couplets • Two namespaces: Atlas1 and Atlas2 SFA12K SFA12K – 18 Couplets each, no shared hardware ICL – Purpose: Load balancing and capacity management Couplet • Why a couplet – Failover configuration Disk Enclosures – Bottleneck: ICL (Inter Controller Link) • Designed for mixed random I/O workload – Non-sequential read and write I/O patterns 5
Spider File System - Comparison Spider 1 Spider 2 Years 2008 – 2014 2014 onwards Bandwidth 240 GB/s +1 TB/s Capacity 10 PB 32 PB RAID Controller DDN S2A9000 DDN SFA12KX Disk Type SATA Near-line SAS Number of disks 13,440 20,160 Connectivity IB DDR IB FDR Number of OSTs 1,344 2,016 Number of OSSs 192 288 Lustre version 1.8 2.5 Disk Redundancy RAID 6 ( 8 + 2) 6
Workload Comparison: Spider 1 vs. Spider 2 Primary Compute Platform: What changed ? • 2.3 Petaflop Jaguar à 27 Petaflop Titan • CPU à CPU + GPU • Memory: 300 à 710 TeraBytes • 3D Torus Interconnect bandwidth: 3.2GB/s à 10.4 GB/s • I/O router nodes: 192 à 440 What did not change ? • # of compute clients: 18688 • Spider architecture ( just scaled up) 7
Workload Characterization Workload Data • From the DDN RAID controllers; using ddntool , a custom tool developed at ORNL • Periodic polling: read/write bandwidth and IOPS, request size and latency data. • Spider 1 data from 2010 (Jan – June); Spider 2 data from 2015 (April – August) Characterization Metrics DDN SFA12KX • I/O Access (Read vs Write) ddntool , • Peak bandwidth utilization DDN SFA12KX MySQL management database .... server • I/O Bandwidth usage trends DDN SFA12KX Data collection system • Request size distribution • Service latency distribution 8
Read vs Write 100 Write Percentage (%) ~ 60% of I/O is write 80 Spider 1 60 40 20 0 1 3 5 7 9 11 13 15 17 19 21 23 25 27 29 31 33 35 37 39 41 43 45 47 DDN Controllers(1-48) 100 > 75% of I/O is write Write Percentage (%) 80 60 Spider 2 40 20 0 2 4 6 8 10 12 14 16 18 20 22 24 26 28 30 32 34 36 DDN Couplets(1-36) 9
Peak Bandwidth Utilization Peak Bandwidth Max Read Max Write Spider 1 % of Peak Bandwidth 100 • ~ 90% for read 80 • Only 50% for write 60 Spider 1 40 20 0 Spider 2 1 3 5 7 9 11 13 15 17 19 21 23 25 27 29 31 33 35 37 39 41 43 45 47 DDN Controllers(1-48) • ~ 80% for read • ~ 75% for write Max Read Max Write % of Peak Bandwidth 100 Reasons: 80 • Larger request sizes 60 Spider 2 • Write-back cache 40 enabled 20 0 2 4 6 8 10 12 14 16 18 20 22 24 26 28 30 32 34 36 DDN Couplets(1-36) 10
Spider 2 - Bandwidth Usage Trends 1 • ~92% time usage is less than < 5 GB/s 0.8 • This is expected Distribution P(x) 0.6 • Most applications are compute-intensive 0.4 • < 5% of runtime is spent on I/O 0.2 • Scientific application’s I/O are bursty Aggregate bandwidth 0 0 5 10 50 100 150 200 250 BURST BUFFER !!!! Bandwidth (GB/s) Cumulative Distribution Function (CDF) ~50% of our storage space is utilized on an 60 % of 32 PB Percentage (%) average with 50 • Data being purged periodically • Large file system idle time (<5GB/s) 40 1 2 3 4 5 6 7 8 9 10 11 12 13 14 15 16 17 18 19 20 21 22 23 24 25 26 27 28 29 30 Time(days of a month) Storage system usage over a month 11
Request Size Distribution Probability Distribution Function (PDF) 0.7 0.7 Read Read Write Write 0.6 0.6 0.5 0.5 Distribution P(x) Distribution P(x) 0.4 0.4 0.3 0.3 0.2 0.2 0.1 0.1 0 0 4k 8k 16k 32k 64k 128k 512k 1M 2M 4M 4k 8k 16k 32k 64k 128k 512k 1M 2M 4M Request Size Request Size Spider 1 Spider 2 • Smallest measurable unit on Spider 1 is 16 KB, Spider 2 is 4KB • Large 512 KB requests on Spider 1 • dm-multipath issue, breaks1MB requests to 2, 512 KB requests • deadline I/O request scheduler, in 2011 migrated to noop scheduler 12
Request Service Latency Distribution Spider 2 1 1 Read Read Write Write 0.9 0.95 0.8 Distribution P(x) Distribution P(x) 0.7 0.9 0.6 0.85 0.5 0.4 0.8 0.3 0.2 0.75 0.1 0.7 0 16 32 64 128 256 512 1000 16 32 64 128 256 512 1000 Request Latency(ms) Request Latency(ms) Cumulative Distribution Function (CDF) Probability Distribution Function (PDF) • Service Latency = Queue time + Disk I/O time • 90% of read requests, and 80% of write requests served in less than 16ms • 16ms is the smallest measurable unit on the DDN controllers 13
Request Service Latency Distribution • Read-ahead cache disabled – Mixed aggregate read workload is non-sequential – Prefetching read blocks impacts performance (cache trashing) • Write-back cache enabled – ReACT (Real-time Adaptive Cache Technology) – 1MB data blocks written to disk directly, no caching on peer controller – <1MB data blocks • Cached and mirrored on either controllers • Grouped for single large block write 14
Conclusion • What is our next storage system (for Summit 100+petaflop) ? – Simply scale up Spider 2 ? Not very likely !!!! – But we will need a center-wide shared storage system like Spider – Explore: Burst Buffer or an intermediate fast I/O cache layer • Expected I/O workload trends – Increased write I/O – Bursty, with identical or increased file system idle times – Support for larger request sizes • Open Questions – How does the next generation of compute platform affect storage system design – Summit: 20+ à 100+ Petaflops but scaling down from 18k to 4k compute nodes 15
Recommend
More recommend
Explore More Topics
Stay informed with curated content and fresh updates.


![Chapter 7: Runtime Environment Run time memory organization. char abc[1000]; char](https://c.sambuz.com/989981/chapter-7-runtime-environment-s.webp)
