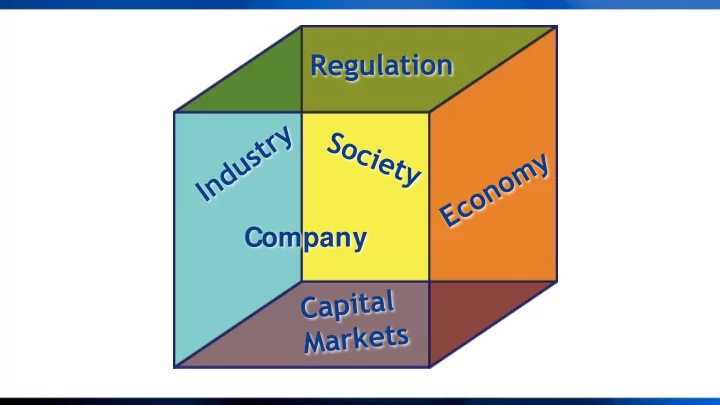

Company
Neutron Legislation - Late 1980s “It was OK to lend money to build a building, but it wasn’t OK to lend money to any company that would hire a person to work in the building.”
Examples of Regulation Following Volatility Period Volatility Regulation 1780s Weak state currencies Constitution/Commerce Clause 1830s-1850s Wildcat state banking National currency/Banking acts 1893 Stock market panic Bankruptcy Act 1907 Run on trust companies Federal Reserve Act 1929-1933 Market crash Securities & Exchange Act 1930-1933 Bank failures Glass-Steagall Act, FDIC, New Deal 1970s Commodities speculation CFTC 1970-90s Employment insecurity ERISA, COBRA, HIPAA 1987 S&L Crisis FIRREA 2002 Dot.com/Enron/etc. Sarbanes-Oxley 2008 Great Recession Dodd-Frank
Pages in the Code of Federal Regulations 180,000 160,000 140,000 120,000 100,000 80,000 60,000 1975 1983 1991 1999 2007 2015 Source: Georg Washington University Regulatory Studies Center, 2015.
Regulation Complexity 6 pages More than 2,000 pages… … longer than the Torah, Bible and Quran COMBINED!
High-Yield Annual Returns 1982 - 1990 50% 40% 30% 20% 10% 0% -10% 1982 1983 1984 1985 1986 1987 1988 1989 1990 Sources: Bank of America; Merrill Lynch, March 23, 2012
High-Yield Annual Returns 11/29/1990: comment in The Wall Street Journal : “ Mr. Milken’s central tenet – that a portfolio of junk bonds will generate yields superior to a portfolio of investment-grade debt – may yet prove a fallacy of the ’ 80s, however accurate his proposition may have been in other periods. ” Sources: Bank of America; Merrill Lynch, March 23, 2012
High-Yield Annual Returns 1982 - 1991 50% 46.3% 40% 30% 20% 10% 0% -10% 1982 1983 1984 1985 1986 1987 1988 1989 1990 1991 Sources: Bloomberg and Merrill Lynch
High-Yield Annual Returns 2004 - 2018 Percent 60 40 20 0 -20 -40 2004 2006 2008 2010 2012 2014 2016 2018* Note: Return for 2018 as of August 20, 2018. Sources: Bloomberg (8/21/2018).
High-Yield Bonds vs. Inflation and Treasuries Index, December 1987 = 100 High Yield 1,200 1,000 800 600 Treasuries 400 200 Inflation 0 1987 1992 1997 2002 2007 2012 2018 Note: BofA Merrill Lynch High Yield Master II, BofA Merrill Lynch Treasury Master, CPI. Sources: Thomson Reuters (8/21/2018).
Central Bank Target Interest Rates Begin to Rise Percent 7 Bank of England 6 5 4 3 European Central Bank 2 U.S. Federal Reserve 1 0 Bank of Japan -1 2005 2006 2007 2008 2009 2010 2011 2012 2013 2014 2015 2016 2017 2018 Source: Thomson Reuters (8/21/2018).
Central Bank Assets US$ trillions European Central Bank U.S. Federal Reserve 15 Bank of Japan 12 Bank of England 9 6 3 0 2006 2007 2008 2009 2010 2011 2012 2013 2014 2015 2016 2017 2018 Source: Thomson Reuter (6/25/2018).
Recommend
More recommend